|
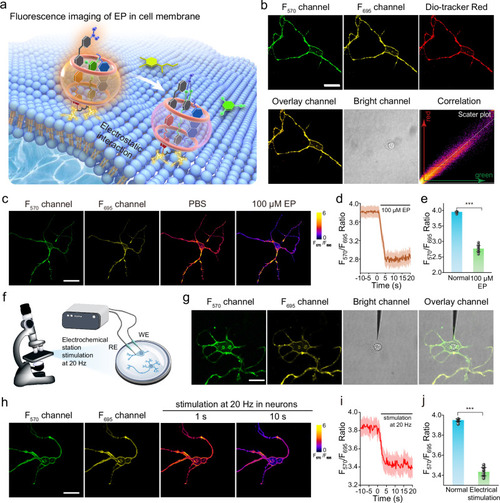
Fluorescence imaging and real-time quantification of EP in neurons. a Fluorescence imaging and real-time quantification of EP in cell membrane. b Confocal fluorescence images of neurons costained with CMG2 and a commercial membrane probe (Dio). Three independent experiments were repeated and similar results were obtained. Scale bar: 15 μm. c Representative images showing the fluorescence images of CMG2 at cell membrane and their response to 100 μm EP. Scale bar: 15 μm. d Representative traces of CMG2 in response to 100 μm EP. e Dynamic response summary of CMG2 in response to 100 μm EP (n = 15 cells). f Schematic diagram of electrically stimulated neurons. g Confocal fluorescence images of electrically stimulated neurons. Scale bar: 10 μm. h Time-lapse confocal fluorescence images of CMG2-incubated neurons after electrical stimulation. Scale bar: 15 μm. i Representative traces of CMG2 after electrical stimulation (n = 15 cells). j Dynamic response summary of CMG2 after electrical stimulation. The above-mentioned data are all presented as mean ± S.D. Error bars: S.D., gray dots represent individual data points. Statistical significance is calculated with a two-tailed unpaired t-test and P values are indicated (***p < 0.001). Source data are provided as a Source Data file.
|