IMAGE

Fig. 6

ID
ZDB-IMAGE-250225-84
Source
Figures for Zhao et al., 2025
Image
Figure Caption

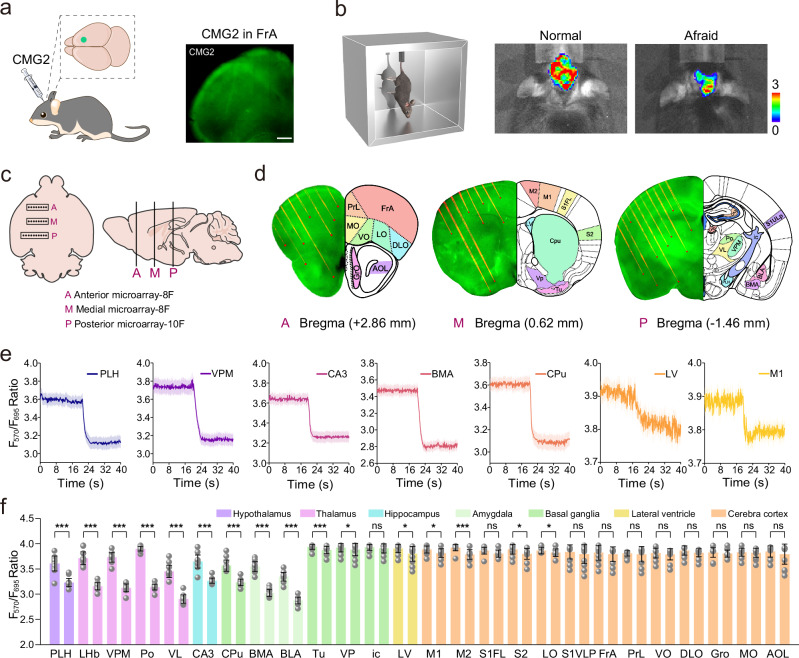
Fig. 6 Real-time monitoring and quantifying of EP in 26 brain regions.

a Schematic illustration depicting probe injection and fluorescence imaging in vivo. Example image showing CMG2 in FrA in a coronal brain slice; Scale bar: 500 μm. b Schematic cartoon illustrating tail suspension experiments. In vivo imaging of normal and afraid-model mouse brains stained with CMG2. c An overhead and lateral view of the brain surface implanted with A multi-fiber microarray, including anterior (A) middle (M) and posterior (P). d Distribution of brain slices in different areas and three-dimensional remapping of Allen brain Atlas. e Fluorescence signal F570/F695 ratio changes in seven representative brain regions with time after tail suspension stimulation. f Quantized maps of fluorescence signals in 26 different brain regions (n  =  15 independent experiments). The above-mentioned data are all presented as mean ± S.D. Error bars: S.D., white dots represent individual data points. Statistical significance is calculated with a two-tailed unpaired t-test and P values are indicated (nsp > 0.05, *p  <  0.05, **p  <  0.01, and ***p <  0.001). Source data are provided as a Source Data file.

Acknowledgments
This image is the copyrighted work of the attributed author or publisher, and ZFIN has permission only to display this image to its users. Additional permissions should be obtained from the applicable author or publisher of the image. Full text @ Nat. Commun.