FIGURE

Fig. 5

ID
ZDB-FIG-250225-81
Publication
Zhao et al., 2025 - Molecularly engineered supramolecular fluorescent chemodosimeter for measuring epinephrine dynamics
Other Figures
All Figure Page
Back to All Figure Page
Fig. 5

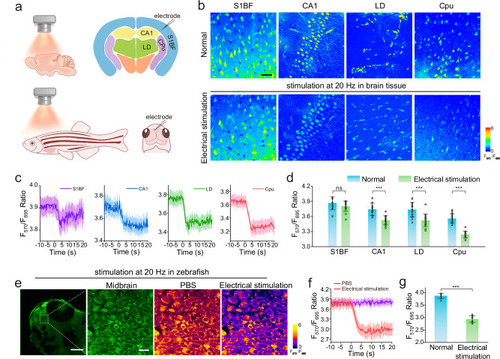
Fluorescence imaging and real-time quantification of EP in brain tissues and zebrafish.

a Fluorescence imaging and real-time quantification of EP in brain tissue and zebrafish. b Fluorescence images of brain tissue slices from S1BF, CA1, LD and Cpu regions incubated with CMG2 after electrical stimulation. Scale bar: 75 μm. c Representative traces of CMG2 in S1BF, CA1, LD and Cpu after electrical stimulation. d Dynamic response summary of CMG2 after electrical stimulation in S1BF, CA1, LD and Cpu (n  =  15 independent experiments). e Fluorescence images of zebrafish incubated with CMG2 after electrical stimulation. Scale bar: 130 μm and 10 μm. f Representative traces of CMG2 in zebrafish after electrical stimulation. g Dynamic response summary of CMG2 after electrical stimulation in zebrafish (n  =  15 independent experiments) The above-mentioned data are all presented as mean ± S.D. Error bars: S.D., gray dots represent individual data points. Statistical significance is calculated with a two-tailed unpaired t-test and P values are indicated (nsp > 0.05, *p  <  0.05, **p  <  0.01, and ***p  <  0.001). Source data are provided as a Source Data file.

Expression Data

Expression Detail
Antibody Labeling
Phenotype Data

Phenotype Detail
Acknowledgments
This image is the copyrighted work of the attributed author or publisher, and ZFIN has permission only to display this image to its users. Additional permissions should be obtained from the applicable author or publisher of the image. Full text @ Nat. Commun.