IMAGE

Fig. 4

ID
ZDB-IMAGE-250225-82
Source
Figures for Zhao et al., 2025
Image
Figure Caption

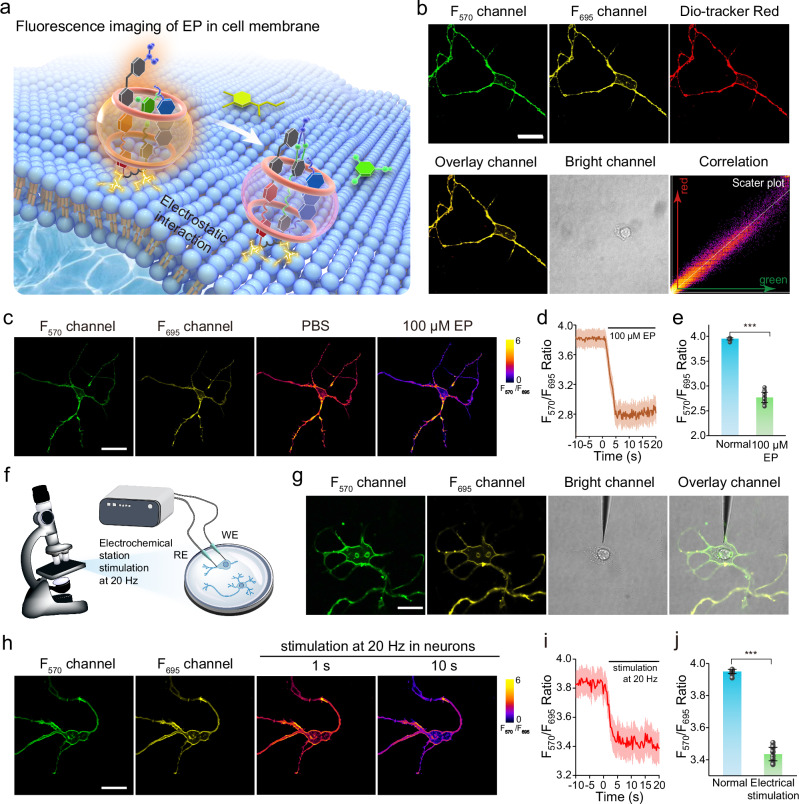
Fig. 4 Fluorescence imaging and real-time quantification of EP in neurons.

a Fluorescence imaging and real-time quantification of EP in cell membrane. b Confocal fluorescence images of neurons costained with CMG2 and a commercial membrane probe (Dio). Three independent experiments were repeated and similar results were obtained. Scale bar: 15 μm. c Representative images showing the fluorescence images of CMG2 at cell membrane and their response to 100 μm EP. Scale bar: 15 μm. d Representative traces of CMG2 in response to 100 μm EP. e Dynamic response summary of CMG2 in response to 100 μm EP (n = 15 cells). f Schematic diagram of electrically stimulated neurons. g Confocal fluorescence images of electrically stimulated neurons. Scale bar: 10 μm. h Time-lapse confocal fluorescence images of CMG2-incubated neurons after electrical stimulation. Scale bar: 15 μm. i Representative traces of CMG2 after electrical stimulation (n = 15 cells). j Dynamic response summary of CMG2 after electrical stimulation. The above-mentioned data are all presented as mean ± S.D. Error bars: S.D., gray dots represent individual data points. Statistical significance is calculated with a two-tailed unpaired t-test and P values are indicated (***p <  0.001). Source data are provided as a Source Data file.

Acknowledgments
This image is the copyrighted work of the attributed author or publisher, and ZFIN has permission only to display this image to its users. Additional permissions should be obtained from the applicable author or publisher of the image. Full text @ Nat. Commun.