
- Title
-
Transgenerational toxicity assessment of [C8mim]Br: Focus on early development, antioxidant defense, and transcriptome profiles in zebrafish
- Authors
- Zhao, F., Shen, Y., Ma, Z., Tian, H., Duan, B., Xiao, Y., Liu, C., Shi, X., Chen, D., Wei, W., Jiang, R., Wei, P.
- Source
- Full text @ Ecotoxicol. Environ. Saf.

Experimental scheme diagram (A) and the early growth of F1 embryo-larvae derived from parents exposed to 0, 25, 250, and 2500 μg/L of [C8mim]Br for eight weeks (B–E). Significant differences between the [C8mim]Br exposure groups and the control group are denoted by * (P < 0.05). |
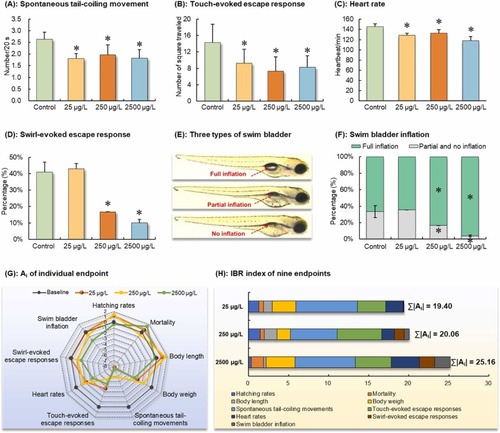
Key early development of F1 embryo-larvae derived from parents exposed to 0, 25, 250, and 2500 μg/L of [C8mim]Br for eight weeks. (A–F): Asterisk (*) denotes the significant differences between the [C8mim]Br exposure groups and the control group (P < 0.05). (E): Representative images illustrating three types of swim bladder inflation, with red dotted arrows indicating fully inflated, partially inflated (less than 50 % of the full inflation), and not inflated swim bladders, respectively. (F): Semiquantitative assessment of swim bladder inflation in F1 larvae at 96 hpf. (G): A radar chart depicting the integrated response of nine endpoints. The farther the dot is from the baseline of 0, the greater the absolute value of the deviation index (Ai) of the endpoint, and the greater its toxicity risk. (H): The sum of the absolute values of Ai (∑|Ai|) across all endpoints contributes to the overall IBR index. |
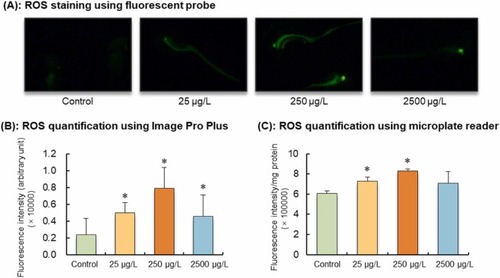
ROS accumulation of F1 larvae (96 hpf) derived from parents exposed to 0, 25, 250, and 2500 μg/L of [C8mim]Br for eight weeks. (A): Representative larvae stained by DCFH-DA probe under a fluorescence microscope. Stronger green fluorescence represents higher ROS content. (B) and (C): Fluorescence intensity was quantified using Image Pro Plus software and microplate reader, respectively. Significant differences between the [C8mim]Br exposure groups and the control group are indicated by * (P < 0.05). |

Oxidative stress biomarkers of F1 larvae (96 hpf) derived from parents exposed to 0, 25, 250, and 2500 μg/L of [C8mim]Br for eight weeks. (A–E): MDA, SOD, GSH, CAT, and GSH-Px levels in whole-body larvae, respectively. (F–H): Gene expression of gclc, gstp1.1, and gstp1.2, respectively. Asterisk (*) denotes the significant differences between the exposure and the control groups (P < 0.05). (I): A radar chart illustrating the integrated response of six biomarkers. Ai greater than 0 and less than 0 means that the biomarker is induced and inhibited, respectively. (J): The sum of the absolute values of Ai (∑|Ai|) across all biomarkers contributes to the overall IBR index. |
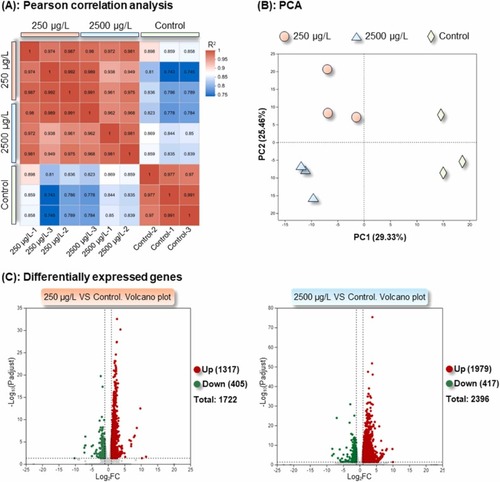
Analyses of sample relationships and differentially expressed genes in F1 larvae (96 hpf) following parental exposure to [C8mim]Br, based on transcriptomic sequencing. (A): Pearson correlation analysis. Each square displays the correlation coefficient between two samples. The higher the value, the greater the correlation between the two samples and the more similar the transcriptome profiles. (B): Principal component analysis. A shorter distance between two samples signifies a higher similarity between them. (C) and (D): Volcano plots of differentially expressed genes in the 250 and 2500 μg/L exposure groups relative to the control, respectively. |

GO term and KEGG pathway enrichment analyses of the differentially expressed genes in F1 larvae (96 hpf) following parental exposure to [C8mim]Br, based on the transcriptome. (A) and (B): A bubble chart illustrating the top 20 GO terms enriched in the 250 and 2500 μg/L exposure groups, respectively. (C) and (D): A chord diagram depicting the top 10 KEGG pathways enriched in the 250 and 2500 μg/L exposure groups, respectively. The GO terms and KEGG pathways of interest are highlighted in yellow. |
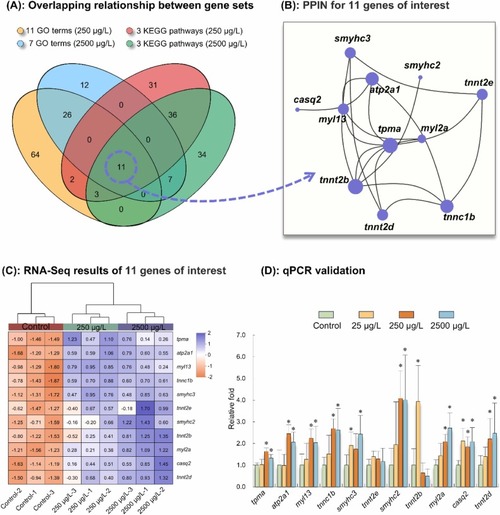
Analysis of differentially expressed genes of interest in F1 larvae (96 hpf) following parental exposure to [C8mim]Br, based on the transcriptome. (A): A Venn diagram illustrating the overlapping relationships between the GO terms and KEGG pathways of interest. (B): Protein-protein interaction network for the 11 candidate genes. Nodes represent genes, and connecting lines represent interactions between two genes. The size of a node is proportional to the connectivity of the node, that is, the more lines connected to this node, the greater the importance of the gene within the network. (C): Heatmap of relative expression of 11 genes of interest, based on RNA-Seq results. The lower the expression abundance of a gene, the lower the value of the processed data, and the more the color tends to be light orange. Conversely, the higher the expression abundance of a gene, the higher the value of the processed data, and the more the color tends to be light blue. (D): RT-qPCR validation results. Significant differences between the [C8mim]Br exposure groups and the control group are indicated by * (P < 0.05). |