
Image
|
Figure Caption
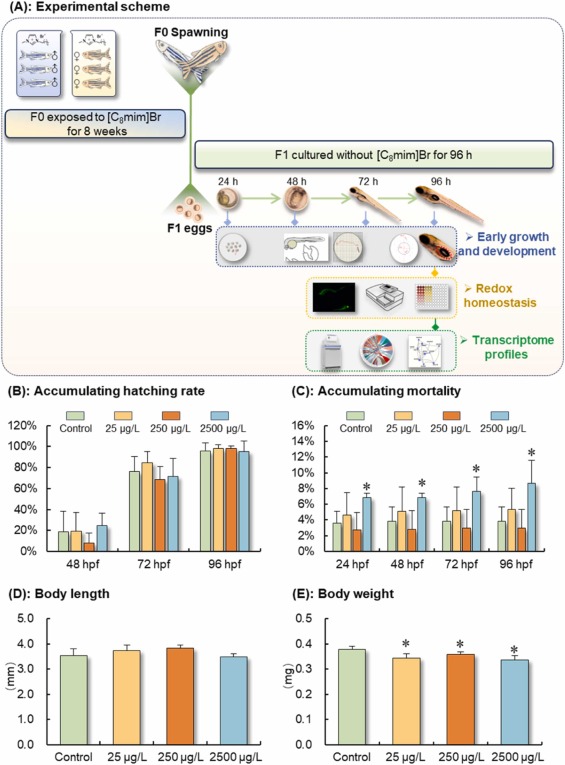
Fig. 1 Experimental scheme diagram (A) and the early growth of F1 embryo-larvae derived from parents exposed to 0, 25, 250, and 2500 μg/L of [C8mim]Br for eight weeks (B–E). Significant differences between the [C8mim]Br exposure groups and the control group are denoted by * (P < 0.05).
Acknowledgments
This image is the copyrighted work of the attributed author or publisher, and
ZFIN has permission only to display this image to its users.
Additional permissions should be obtained from the applicable author or publisher of the image.
Full text @ Ecotoxicol. Environ. Saf.