
Image
|
Figure Caption
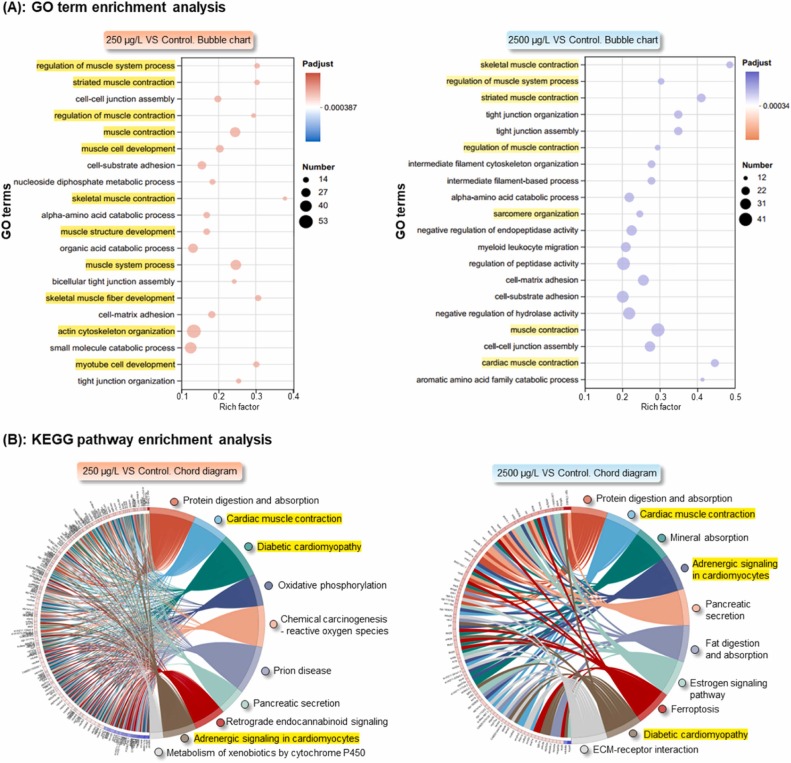
Fig. 6 GO term and KEGG pathway enrichment analyses of the differentially expressed genes in F1 larvae (96 hpf) following parental exposure to [C8mim]Br, based on the transcriptome. (A) and (B): A bubble chart illustrating the top 20 GO terms enriched in the 250 and 2500 μg/L exposure groups, respectively. (C) and (D): A chord diagram depicting the top 10 KEGG pathways enriched in the 250 and 2500 μg/L exposure groups, respectively. The GO terms and KEGG pathways of interest are highlighted in yellow.
Acknowledgments
This image is the copyrighted work of the attributed author or publisher, and
ZFIN has permission only to display this image to its users.
Additional permissions should be obtained from the applicable author or publisher of the image.
Full text @ Ecotoxicol. Environ. Saf.