
Fig. 2
- ID
- ZDB-FIG-250403-61
- Publication
- Zhao et al., 2025 - Transgenerational toxicity assessment of [C8mim]Br: Focus on early development, antioxidant defense, and transcriptome profiles in zebrafish
- Other Figures
- All Figure Page
- Back to All Figure Page
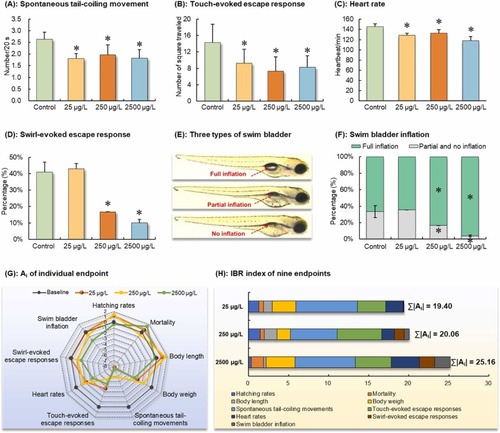
Key early development of F1 embryo-larvae derived from parents exposed to 0, 25, 250, and 2500 μg/L of [C8mim]Br for eight weeks. (A–F): Asterisk (*) denotes the significant differences between the [C8mim]Br exposure groups and the control group (P < 0.05). (E): Representative images illustrating three types of swim bladder inflation, with red dotted arrows indicating fully inflated, partially inflated (less than 50 % of the full inflation), and not inflated swim bladders, respectively. (F): Semiquantitative assessment of swim bladder inflation in F1 larvae at 96 hpf. (G): A radar chart depicting the integrated response of nine endpoints. The farther the dot is from the baseline of 0, the greater the absolute value of the deviation index (Ai) of the endpoint, and the greater its toxicity risk. (H): The sum of the absolute values of Ai (∑|Ai|) across all endpoints contributes to the overall IBR index. |