
Fig. 7
- ID
- ZDB-FIG-250403-66
- Publication
- Zhao et al., 2025 - Transgenerational toxicity assessment of [C8mim]Br: Focus on early development, antioxidant defense, and transcriptome profiles in zebrafish
- Other Figures
- All Figure Page
- Back to All Figure Page
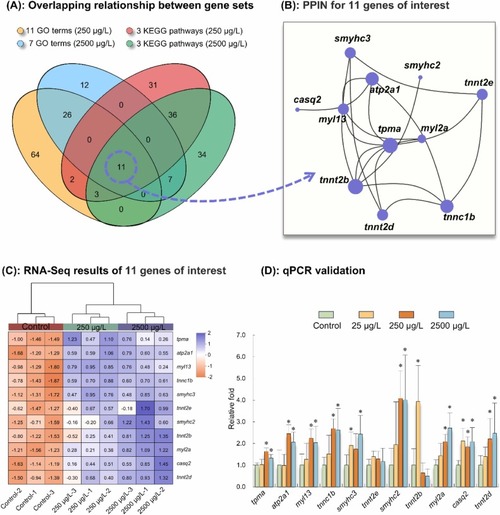
Analysis of differentially expressed genes of interest in F1 larvae (96 hpf) following parental exposure to [C8mim]Br, based on the transcriptome. (A): A Venn diagram illustrating the overlapping relationships between the GO terms and KEGG pathways of interest. (B): Protein-protein interaction network for the 11 candidate genes. Nodes represent genes, and connecting lines represent interactions between two genes. The size of a node is proportional to the connectivity of the node, that is, the more lines connected to this node, the greater the importance of the gene within the network. (C): Heatmap of relative expression of 11 genes of interest, based on RNA-Seq results. The lower the expression abundance of a gene, the lower the value of the processed data, and the more the color tends to be light orange. Conversely, the higher the expression abundance of a gene, the higher the value of the processed data, and the more the color tends to be light blue. (D): RT-qPCR validation results. Significant differences between the [C8mim]Br exposure groups and the control group are indicated by * (P < 0.05). |