
|
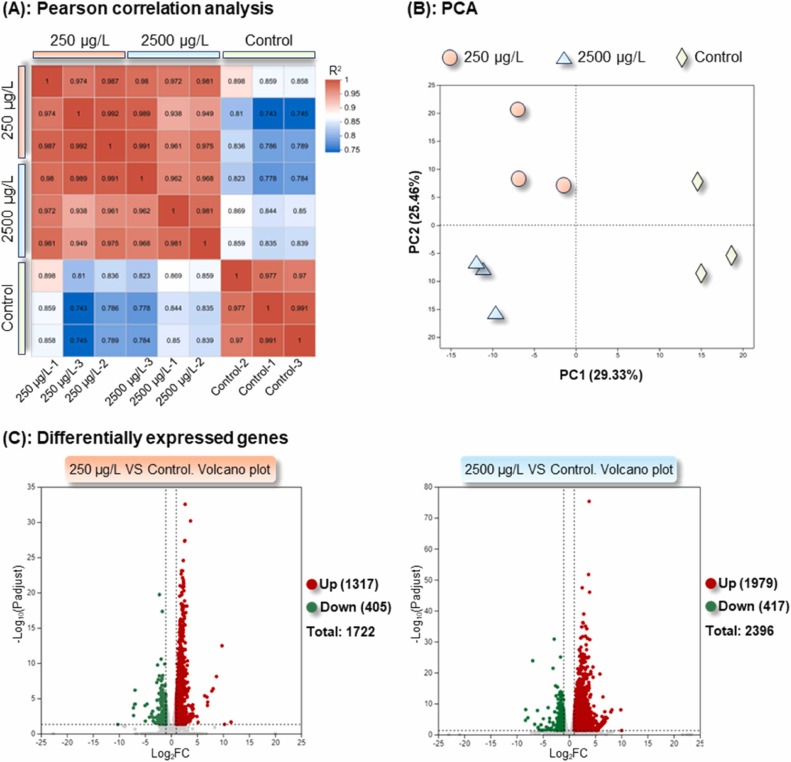
Fig. 5 Analyses of sample relationships and differentially expressed genes in F1 larvae (96 hpf) following parental exposure to [C8mim]Br, based on transcriptomic sequencing. (A): Pearson correlation analysis. Each square displays the correlation coefficient between two samples. The higher the value, the greater the correlation between the two samples and the more similar the transcriptome profiles. (B): Principal component analysis. A shorter distance between two samples signifies a higher similarity between them. (C) and (D): Volcano plots of differentially expressed genes in the 250 and 2500 μg/L exposure groups relative to the control, respectively.