
|
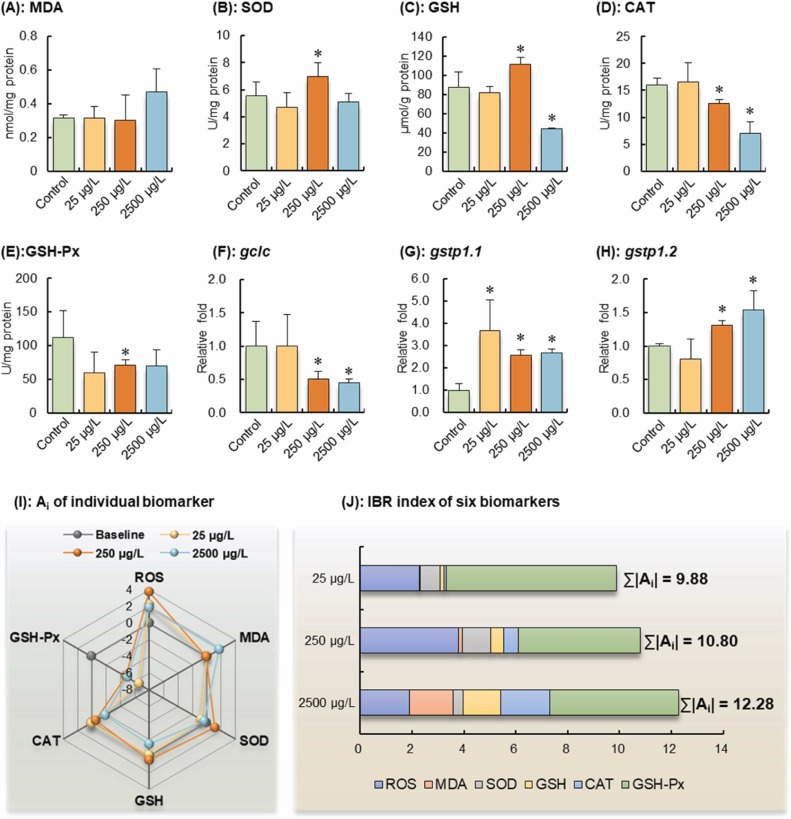
Fig. 4 Oxidative stress biomarkers of F1 larvae (96 hpf) derived from parents exposed to 0, 25, 250, and 2500 μg/L of [C8mim]Br for eight weeks. (A–E): MDA, SOD, GSH, CAT, and GSH-Px levels in whole-body larvae, respectively. (F–H): Gene expression of gclc, gstp1.1, and gstp1.2, respectively. Asterisk (*) denotes the significant differences between the exposure and the control groups (P < 0.05). (I): A radar chart illustrating the integrated response of six biomarkers. Ai greater than 0 and less than 0 means that the biomarker is induced and inhibited, respectively. (J): The sum of the absolute values of Ai (∑|Ai|) across all biomarkers contributes to the overall IBR index.