FIGURE SUMMARY
Title

Type 2 Diabetes Induces Mitochondrial Dysfunction in Zebrafish Skeletal Muscle Leading to Diabetic Myopathy via the miR-139-5p/NAMPT Pathway

Authors
Chen, Z., Zhou, Z., Deng, Q., Zou, Y., Wang, B., Huang, S., Tian, J., Zheng, L., Peng, X., Tang, C.
Source
Full text @ Int. J. Mol. Sci.

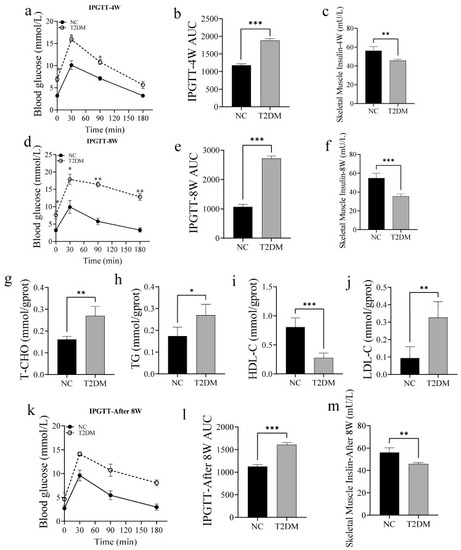
High-glucose treatment resulted in the generation of a zebrafish model of type 2 diabetes mellitus (T2DM). (a) Intraperitoneal glucose tolerance test (IPGTT) curve for zebrafish after 4 weeks of high-glucose treatment (0.5 mg/g body weight (BW)); (b) area under the glucose tolerance curve after 4 weeks of high-glucose treatment; (c) insulin content in skeletal muscle after 4 weeks of high-glucose treatment; (d) IPGTT curve for zebrafish after 8 weeks of high-glucose treatment; (e) area under the glucose tolerance curve after 8 weeks of high-glucose treatment; and (f) insulin content in skeletal muscle after 8 weeks of high-glucose treatment. (g) Total cholesterol (T-CHO); (h) triglyceride (TG); (i) high-density lipoprotein-cholesterol (HDL-C); and (j) low-density lipoprotein-cholesterol (LDL-C). (k) IPGTT curve for zebrafish after normal breeding for 8 weeks following high-glucose intervention for 8 weeks; (l) area under the glucose tolerance curve for zebrafish after normal breeding for 8 weeks following high-glucose intervention for 8 weeks; and (m) insulin content in skeletal muscle of zebrafish after normal breeding for 8 weeks following high-glucose intervention for 8 weeks. * p < 0.05, ** p < 0.01, *** p < 0.001. (n = 6 samples/group).

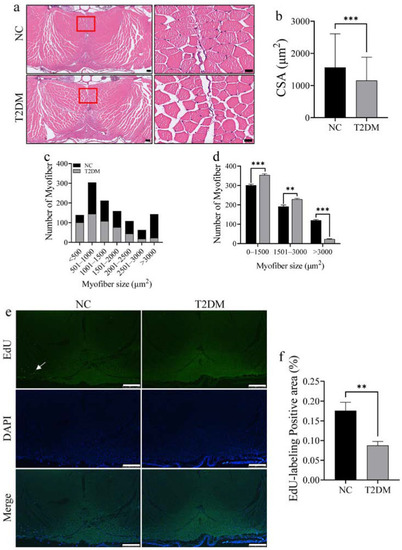
Skeletal muscle mass loss in zebrafish with type 2 diabetes mellitus (T2DM). (a) Hematoxylin and eosin (HE) staining of longitudinal sections of zebrafish tail skeletal muscle in each group, scale bar: 100 μm. The right side is an enlarged view of the red box on the left, scale bar: 20 μm. (b) Analysis of the total muscle fiber areas in each HE-stained section. (c) Analysis of the number of different muscle fiber areas in each HE-stained section. (d) Analysis of the difference in the muscle fiber area of the tail skeletal muscle in each group between 0 and 1500 μm2 (small), 1501 and 3000 μm2 (medium), and 3000 μm2 and above (large). (e) EdU staining intensity of the skeletal muscle of zebrafish, indicating muscle proliferation and regeneration. EdU-labeled areas are indicated by the white arrows, scale bar: 500 μm. (f) Statistical chart of the positive area of EdU labeling. ** p < 0.01, *** p < 0.001. (n = 3 samples/group).

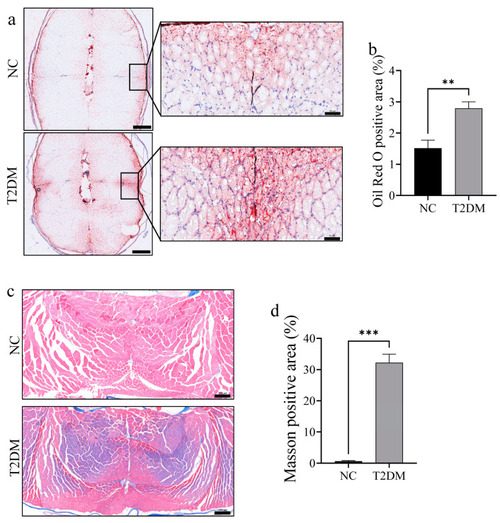
Lipid accumulation and fibrosis were significantly enhanced in the skeletal muscle of zebrafish with type 2 diabetes mellitus (T2DM). (a) Oil red O staining of skeletal muscle after 8 weeks of high-glucose treatment, with red indicating fat-positive staining. The image on the left is a low-magnification image (scale bar: 500 μm); the picture on the right is an enlarged view of the slow-twitch muscle area (scale bar: 50 μm). (b) Positive area of Oil red O staining; (c) Masson staining intensity in the skeletal muscle (scale bar: 200 μm); and (d) statistical chart of Masson staining positive area. ** p < 0.01, *** p < 0.001. (n = 3 samples/group).

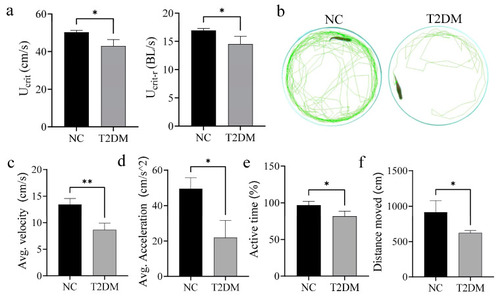
Type 2 diabetes mellitus (T2DM) impairs the motor ability of zebrafish. (a) T2DM significantly reduced the critical swimming speed (Ucrit) and relative critical swimming speed (Ucrit-r, Ucrit/body length (BL)) of zebrafish. (b) Image of zebrafish open-field experiment; (c) average speed of zebrafish open-field experiment; (d) average acceleration of zebrafish in the open-field experiment; (e) proportion of active time in the open-field experiment; and (f) total movement distance of zebrafish in the open field experiment. * p < 0.05, ** p < 0.01. (n = 6 samples/group).

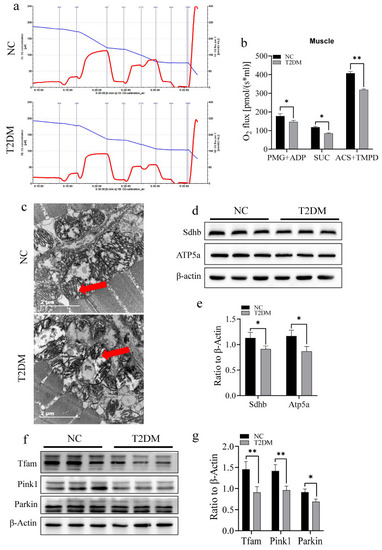
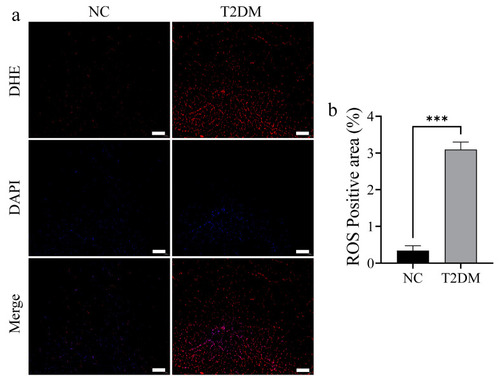
Type 2 diabetes mellitus (T2DM) causes mitochondrial dysfunction in the skeletal muscle of zebrafish. (a) Mitochondrial respiration test chart. The blue curve represents the oxygen content, while the red curve represents the curve of oxygen consumption change. (b) T2DM significantly reduces the respiratory capacity of skeletal muscle mitochondria, where PMG+ADP is the activity of complex I, SUC is the activity of complex II, and ACS+TMPD is the activity of complex IV. (c) Transmission electron microscope image of zebrafish mitochondria; T2DM induces the loss of intramitochondrial cristae (red arrow), scale bar: 2 μm. (d,e) T2DM downregulates the expression of key proteins of the mitochondrial respiratory chain complex in the skeletal muscle of zebrafish (Sdhb and Atp5a). (f,g) T2DM downregulates the expression of key proteins in muscle mitochondrial quality control (Tfam, Pink1, and Parkin). * p < 0.05, ** p < 0.01. (n = 3 samples/group).

Type 2 diabetes mellitus (T2DM) induces inflammatory response in skeletal muscle. (a) Dihydroethidium (DHE) staining of zebrafish skeletal muscle, scale bar: 100 μm. (b) T2DM increases the accumulation of reactive oxygen species in the skeletal muscle. *** p < 0.001. (n = 3 samples/group).

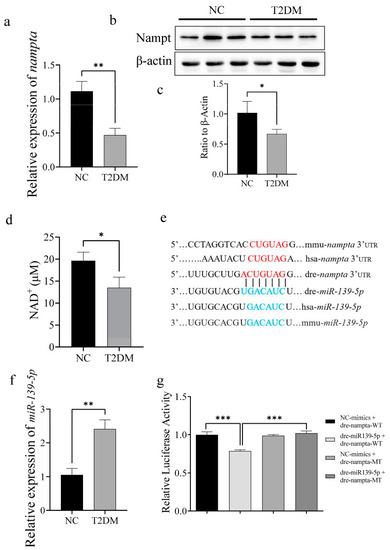
Type 2 diabetes mellitus (T2DM) inhibits NAMPT expression by upregulating miR-139a-5p. (ac) T2DM significantly downregulates NAMPT mRNA and protein expression in the skeletal muscle of zebrafish. (d) T2DM significantly decreased NAD+ content in the skeletal muscle of zebrafish. (e) Using bioinformatics, we predicted that NAMPT is the target gene of miR-139a-5p; the red part is the seed region of NAMPT, and the blue part is the binding site between miR-139a-5p and the NAMPT seed region. (f) T2DM significantly upregulates miR-139a-5p in skeletal muscle. (g) The dual-luciferase reporter assay showed a regulatory relationship between miR-139a-5p and NAMPT. * p < 0.05, ** p < 0.01, *** p < 0.001. (n = 3 samples per group).

Acknowledgments
This image is the copyrighted work of the attributed author or publisher, and ZFIN has permission only to display this image to its users. Additional permissions should be obtained from the applicable author or publisher of the image. Full text @ Int. J. Mol. Sci.