FIGURE

Figure 5

ID
ZDB-FIG-250127-145
Publication
Chen et al., 2025 - Type 2 Diabetes Induces Mitochondrial Dysfunction in Zebrafish Skeletal Muscle Leading to Diabetic Myopathy via the miR-139-5p/NAMPT Pathway
Other Figures
All Figure Page
Back to All Figure Page
Figure 5

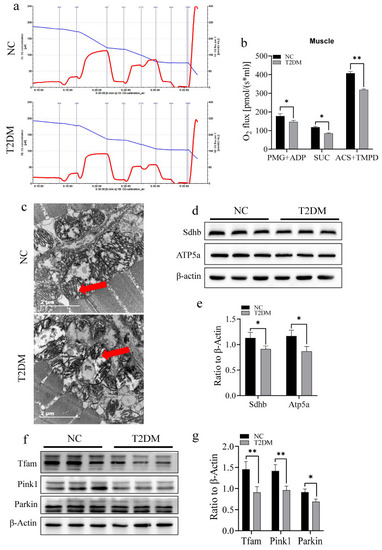
Type 2 diabetes mellitus (T2DM) causes mitochondrial dysfunction in the skeletal muscle of zebrafish. (a) Mitochondrial respiration test chart. The blue curve represents the oxygen content, while the red curve represents the curve of oxygen consumption change. (b) T2DM significantly reduces the respiratory capacity of skeletal muscle mitochondria, where PMG+ADP is the activity of complex I, SUC is the activity of complex II, and ACS+TMPD is the activity of complex IV. (c) Transmission electron microscope image of zebrafish mitochondria; T2DM induces the loss of intramitochondrial cristae (red arrow), scale bar: 2 μm. (d,e) T2DM downregulates the expression of key proteins of the mitochondrial respiratory chain complex in the skeletal muscle of zebrafish (Sdhb and Atp5a). (f,g) T2DM downregulates the expression of key proteins in muscle mitochondrial quality control (Tfam, Pink1, and Parkin). * p < 0.05, ** p < 0.01. (n = 3 samples/group).

Expression Data

Expression Detail
Antibody Labeling
Phenotype Data

Phenotype Detail
Acknowledgments
This image is the copyrighted work of the attributed author or publisher, and ZFIN has permission only to display this image to its users. Additional permissions should be obtained from the applicable author or publisher of the image. Full text @ Int. J. Mol. Sci.