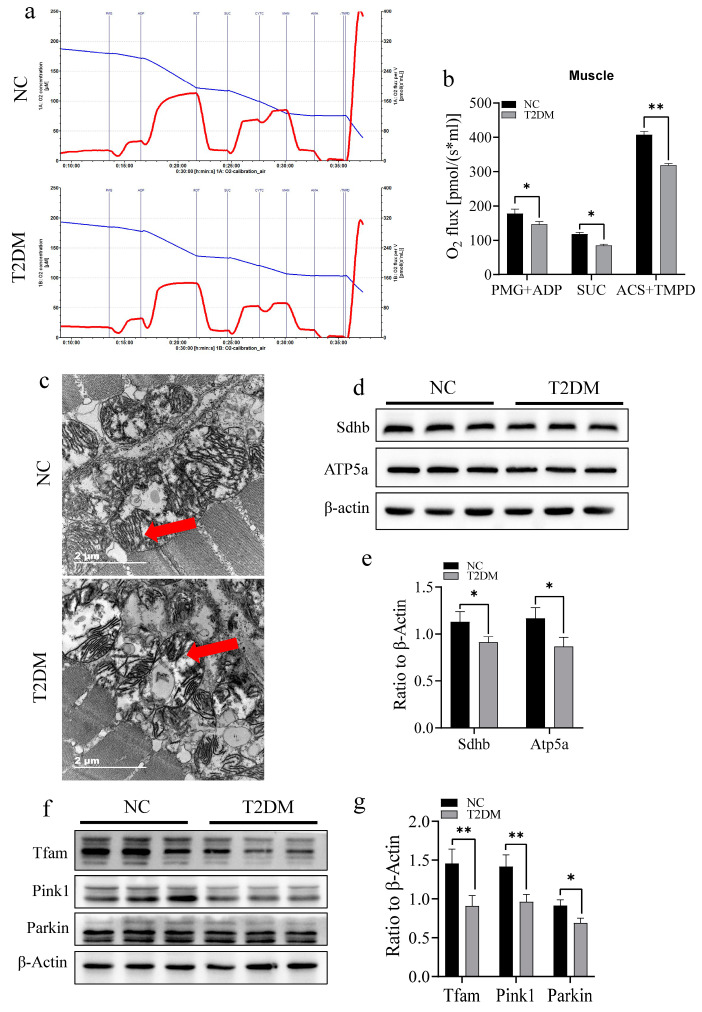
Type 2 diabetes mellitus (T2DM) causes mitochondrial dysfunction in the skeletal muscle of zebrafish. (a) Mitochondrial respiration test chart. The blue curve represents the oxygen content, while the red curve represents the curve of oxygen consumption change. (b) T2DM significantly reduces the respiratory capacity of skeletal muscle mitochondria, where PMG+ADP is the activity of complex I, SUC is the activity of complex II, and ACS+TMPD is the activity of complex IV. (c) Transmission electron microscope image of zebrafish mitochondria; T2DM induces the loss of intramitochondrial cristae (red arrow), scale bar: 2 μm. (d,e) T2DM downregulates the expression of key proteins of the mitochondrial respiratory chain complex in the skeletal muscle of zebrafish (Sdhb and Atp5a). (f,g) T2DM downregulates the expression of key proteins in muscle mitochondrial quality control (Tfam, Pink1, and Parkin). * p < 0.05, ** p < 0.01. (n = 3 samples/group).
Acknowledgments
This image is the copyrighted work of the attributed author or publisher, and
ZFIN has permission only to display this image to its users.
Additional permissions should be obtained from the applicable author or publisher of the image.
Full text @ Int. J. Mol. Sci.
Your Input Welcome
Thank you for submitting comments. Your input has been emailed to ZFIN curators who may contact you if
additional information is required.
Oops. Something went wrong. Please try again later.