IMAGE

Figure 1

ID
ZDB-IMAGE-250127-143
Source
Figures for Chen et al., 2025
Image
Figure Caption

Figure 1

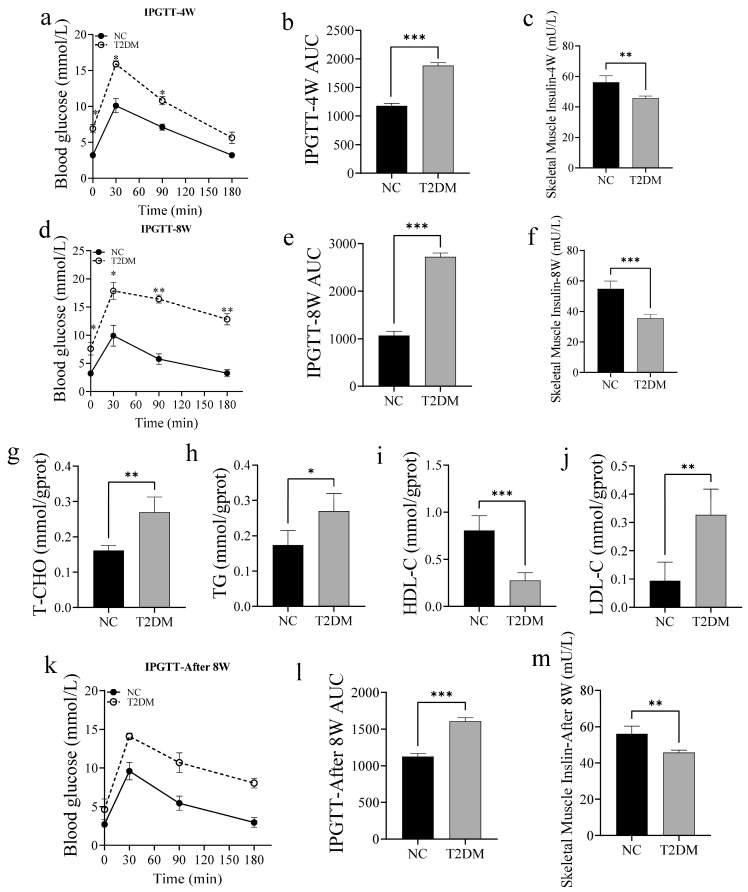
High-glucose treatment resulted in the generation of a zebrafish model of type 2 diabetes mellitus (T2DM). (a) Intraperitoneal glucose tolerance test (IPGTT) curve for zebrafish after 4 weeks of high-glucose treatment (0.5 mg/g body weight (BW)); (b) area under the glucose tolerance curve after 4 weeks of high-glucose treatment; (c) insulin content in skeletal muscle after 4 weeks of high-glucose treatment; (d) IPGTT curve for zebrafish after 8 weeks of high-glucose treatment; (e) area under the glucose tolerance curve after 8 weeks of high-glucose treatment; and (f) insulin content in skeletal muscle after 8 weeks of high-glucose treatment. (g) Total cholesterol (T-CHO); (h) triglyceride (TG); (i) high-density lipoprotein-cholesterol (HDL-C); and (j) low-density lipoprotein-cholesterol (LDL-C). (k) IPGTT curve for zebrafish after normal breeding for 8 weeks following high-glucose intervention for 8 weeks; (l) area under the glucose tolerance curve for zebrafish after normal breeding for 8 weeks following high-glucose intervention for 8 weeks; and (m) insulin content in skeletal muscle of zebrafish after normal breeding for 8 weeks following high-glucose intervention for 8 weeks. * p < 0.05, ** p < 0.01, *** p < 0.001. (n = 6 samples/group).

Acknowledgments
This image is the copyrighted work of the attributed author or publisher, and ZFIN has permission only to display this image to its users. Additional permissions should be obtained from the applicable author or publisher of the image. Full text @ Int. J. Mol. Sci.