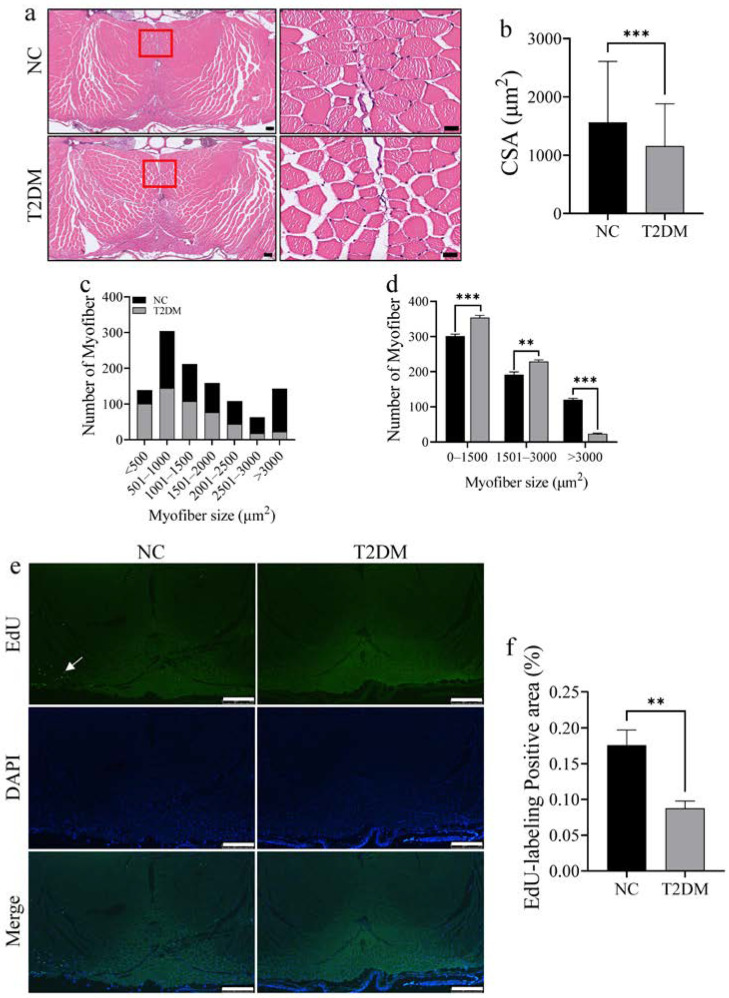
Skeletal muscle mass loss in zebrafish with type 2 diabetes mellitus (T2DM). (a) Hematoxylin and eosin (HE) staining of longitudinal sections of zebrafish tail skeletal muscle in each group, scale bar: 100 μm. The right side is an enlarged view of the red box on the left, scale bar: 20 μm. (b) Analysis of the total muscle fiber areas in each HE-stained section. (c) Analysis of the number of different muscle fiber areas in each HE-stained section. (d) Analysis of the difference in the muscle fiber area of the tail skeletal muscle in each group between 0 and 1500 μm2 (small), 1501 and 3000 μm2 (medium), and 3000 μm2 and above (large). (e) EdU staining intensity of the skeletal muscle of zebrafish, indicating muscle proliferation and regeneration. EdU-labeled areas are indicated by the white arrows, scale bar: 500 μm. (f) Statistical chart of the positive area of EdU labeling. ** p < 0.01, *** p < 0.001. (n = 3 samples/group).
Acknowledgments
This image is the copyrighted work of the attributed author or publisher, and
ZFIN has permission only to display this image to its users.
Additional permissions should be obtained from the applicable author or publisher of the image.
Full text @ Int. J. Mol. Sci.
Your Input Welcome
Thank you for submitting comments. Your input has been emailed to ZFIN curators who may contact you if
additional information is required.
Oops. Something went wrong. Please try again later.