
- Title
-
Lactate accumulation promotes immunosuppression and fibrotic transformation of bone marrow microenvironment in myelofibrosis
- Authors
- Spampinato, M., Giallongo, C., Giallongo, S., Spina, E., Duminuco, A., Longhitano, L., Caltabiano, R., Salvatorelli, L., Broggi, G., Pricoco, E.P., Del Fabro, V., Dulcamare, I., DI Mauro, A.M., Romano, A., Di Raimondo, F., Li Volti, G., Palumbo, G.A., Tibullo, D.
- Source
- Full text @ J Transl Med
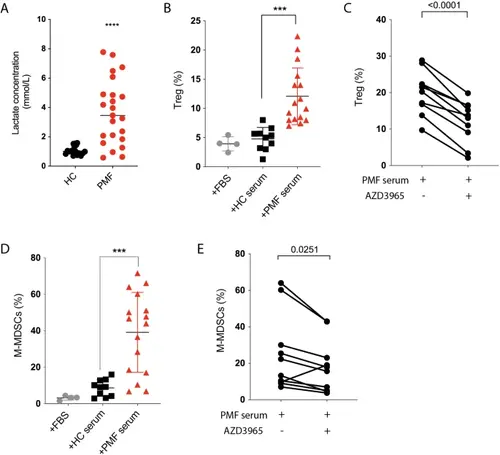
High circulating lactate in MF sera favors immune deregulation. (A) Evaluation of Lactate concentration in PB from healthy and PMF patients. (B) Analysis of the percentage of Treg and (D) M-MDSCs after culturing healthy PBMCs with HC or PMF serum. (C) Evaluation of 10 μM AZD3965 effects on circulating lactate-induced Treg and (E) M-MDSC expansion. Data are presented as means ± SD. ***p < 0.001; ****p < 0.0001 |
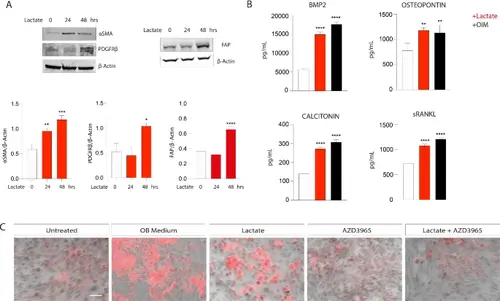
Effect of lactate on stromal cell phenotype. (A) Cropped blots and densitometric analysis from western blot analysis on αSMA, PDGFRβ and FAP, normalized on β-actin. (B) Multiplex immunobead assay technology on culture medium from HS5 cells after 10 days of 20 mM lactate exposure to determine concentrations of indicated osteoblast differentiation markers. (C) Alizarin red S staining for mineralization. The calcified nodules appeared bright red in color. Scale bar: 20 μm. All the data are presented as means ± SD of three independent experiments. *p < 0.05; **p < 0.01; ***p < 0.001; ****p < 0.0001 |
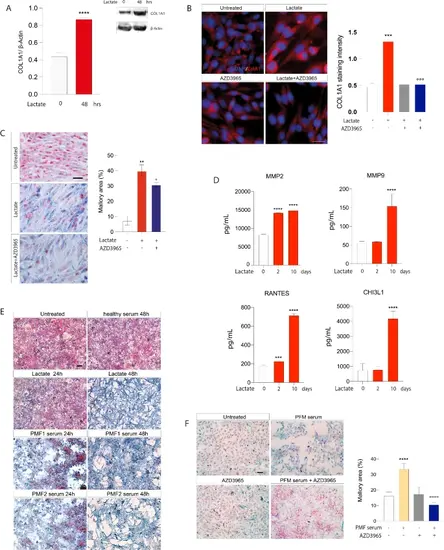
HS5 cells increase collagen deposition after exposure to lactate. (A) Western blot analysis of COL1A1 protein after 20 mM lactate exposure. β-Actin protein was used as total protein loading reference. The optical density of the bands was measured using Scion Image software. (B) Representative pictures of COL1A1 staining in HS5 cells cultured in presence of 20 mM lactate and/or 10 μM AZD3965. Scale bar: 20 μm. Quantification of the protein intensity was calculated and graphed. (C) Evaluation of collagen fibers in HS5 cells after exposure to 20 mM lactate in presence or absence of MCT1 inhibitor for 48 h. Scale bar: 20 μm. Magnification: 40X. Quantification of the Mallory area was calculated and graphed. (D) Multiplex immunobead assay technology on culture medium from HS5 cells after 2 and 10 days of 20 mM lactate exposure to determine concentrations of indicated proteins. (E) Mallory trichrome staining in HS5 after exposure to healthy or PMF sera. Scale bar: 100 μm; magnification: 10X. (F) PMF serum with or without 10 μM AZD3965. Quantification of the Mallory area was calculated and graphed. Scale bar: 20 μm; magnification: 20X. All the data are presented as means ± SD of three independent experiments. **p < 0.01, ***p < 0.001, ****p < 0.0001 versus untreated; °p < 0.05 and °°°p < 0.001 versus lactate alone; °°°°p < 0.0001 versus PMF serum |
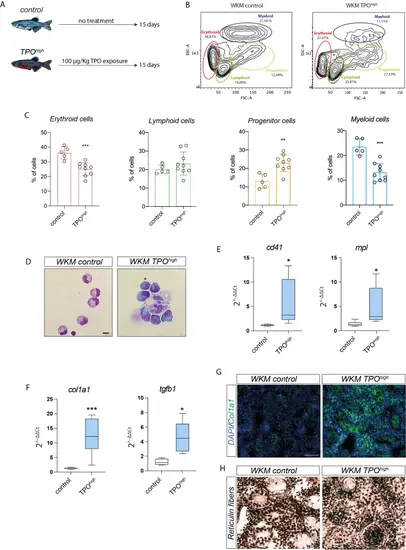
TPOhigh zebrafish as an in vivo model of megakaryocyte expansion and fibrosis development. (A) A schematic view of TPOhigh zebrafish model. (B) Flow cytometry analysis of WKM in control and TPOhigh zebrafish. (C) Evaluation of the percentage of each blood lineage after TPO treatment. (D) May-Grünwald Giemsa images of hematopoietic cells isolated from WKM of control and TPOhigh zebrafish. Scale bar: 5 μm. (E) qPCR analysis of megakaryocytic markers and (F) col1a1 and tgfb1 expression in WKM. B2m was used as housekeeping gene. Calculated value of 2^−ΔΔCt in control was 1. (G) Representative immunofluorescence images of Col1A1 and (H) immunohistochemical images of reticulum fibers in control and TPOhigh zebrafish. Scale bar: 40 μm; magnification: 40X. *p < 0.05; **p < 0.01; ***p < 0.001 |
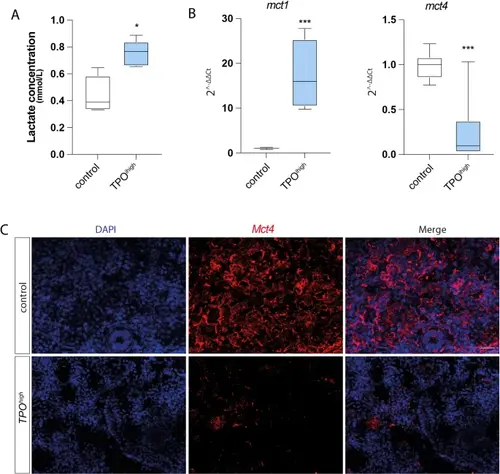
Alteration of lactate and its transporters in TPOhigh zebrafish model. (A) Evaluation of lactate concentration in WKM from control and TPOhigh zebrafish. (B) qPCR analysis of mct1 and mct4 in WKM from control and TPOhigh animals. (C) Representative immunofluorescence images for Mct4. Scale bar: 20 μm. All the data are presented as means ± SD of three independent experiments. *p < 0.05; ***p < 0.001 |
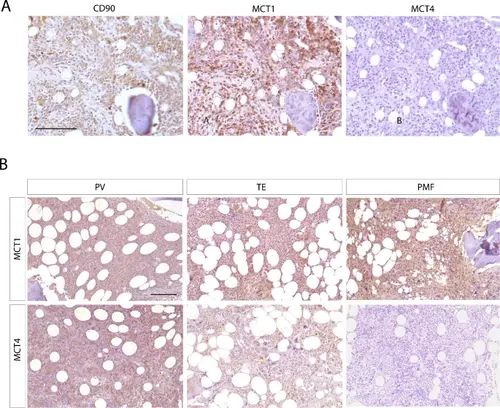
MCTs expression in BM biopsies from MPN patients.(A) Immunohistochemical analysis of CD90, MCT1 and MT4 expression in three consecutive sections from a PMF BM biopsy. (B) Representative immunohistochemical images of MCT1 and MCT4 in BM slides from PV, TE and PMF patients. Scale bar: 500 px |