
|
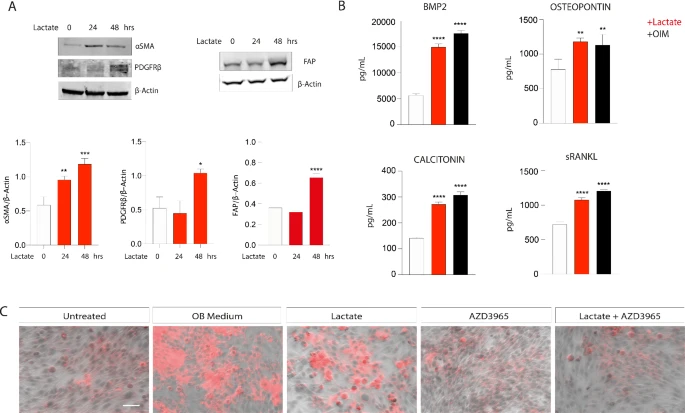
Fig. 2 Effect of lactate on stromal cell phenotype. (A) Cropped blots and densitometric analysis from western blot analysis on αSMA, PDGFRβ and FAP, normalized on β-actin. (B) Multiplex immunobead assay technology on culture medium from HS5 cells after 10 days of 20 mM lactate exposure to determine concentrations of indicated osteoblast differentiation markers. (C) Alizarin red S staining for mineralization. The calcified nodules appeared bright red in color. Scale bar: 20 μm. All the data are presented as means ± SD of three independent experiments. *p < 0.05; **p < 0.01; ***p < 0.001; ****p < 0.0001