|
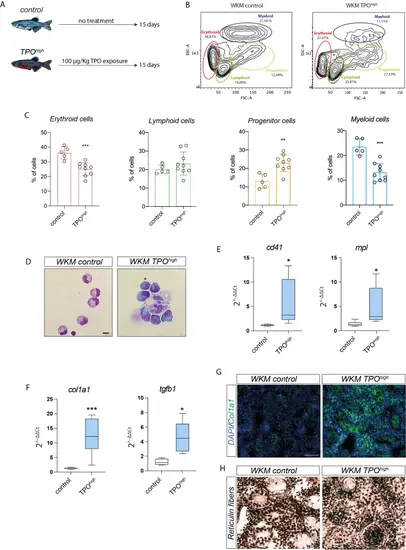
TPOhigh zebrafish as an in vivo model of megakaryocyte expansion and fibrosis development. (A) A schematic view of TPOhigh zebrafish model. (B) Flow cytometry analysis of WKM in control and TPOhigh zebrafish. (C) Evaluation of the percentage of each blood lineage after TPO treatment. (D) May-Grünwald Giemsa images of hematopoietic cells isolated from WKM of control and TPOhigh zebrafish. Scale bar: 5 μm. (E) qPCR analysis of megakaryocytic markers and (F) col1a1 and tgfb1 expression in WKM. B2m was used as housekeeping gene. Calculated value of 2^−ΔΔCt in control was 1. (G) Representative immunofluorescence images of Col1A1 and (H) immunohistochemical images of reticulum fibers in control and TPOhigh zebrafish. Scale bar: 40 μm; magnification: 40X. *p < 0.05; **p < 0.01; ***p < 0.001
|