
|
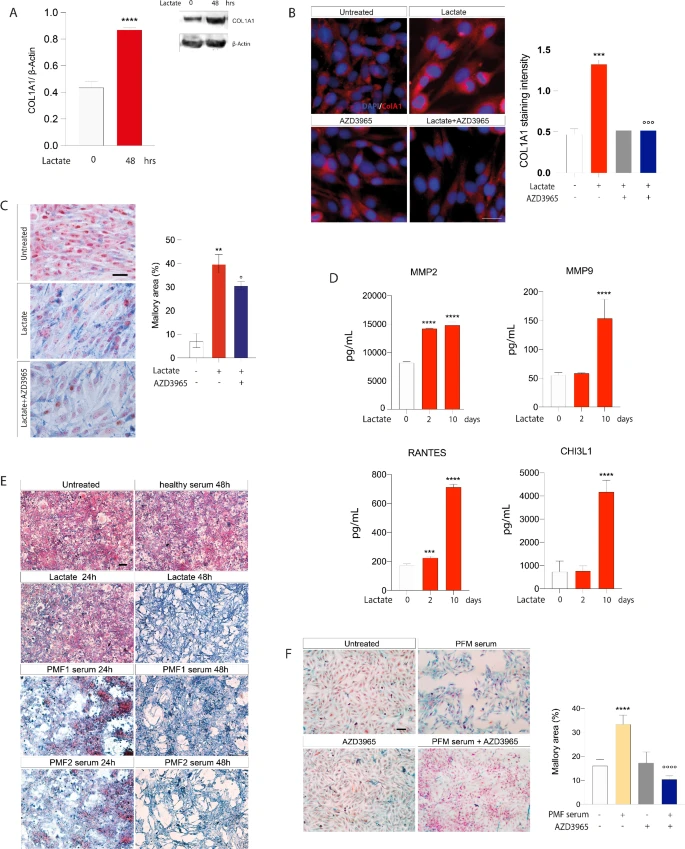
Fig. 3 HS5 cells increase collagen deposition after exposure to lactate. (A) Western blot analysis of COL1A1 protein after 20 mM lactate exposure. β-Actin protein was used as total protein loading reference. The optical density of the bands was measured using Scion Image software. (B) Representative pictures of COL1A1 staining in HS5 cells cultured in presence of 20 mM lactate and/or 10 μM AZD3965. Scale bar: 20 μm. Quantification of the protein intensity was calculated and graphed. (C) Evaluation of collagen fibers in HS5 cells after exposure to 20 mM lactate in presence or absence of MCT1 inhibitor for 48 h. Scale bar: 20 μm. Magnification: 40X. Quantification of the Mallory area was calculated and graphed. (D) Multiplex immunobead assay technology on culture medium from HS5 cells after 2 and 10 days of 20 mM lactate exposure to determine concentrations of indicated proteins. (E) Mallory trichrome staining in HS5 after exposure to healthy or PMF sera. Scale bar: 100 μm; magnification: 10X. (F) PMF serum with or without 10 μM AZD3965. Quantification of the Mallory area was calculated and graphed. Scale bar: 20 μm; magnification: 20X. All the data are presented as means ± SD of three independent experiments. **p < 0.01, ***p < 0.001, ****p < 0.0001 versus untreated; °p < 0.05 and °°°p < 0.001 versus lactate alone; °°°°p < 0.0001 versus PMF serum