
Image
|
Figure Caption
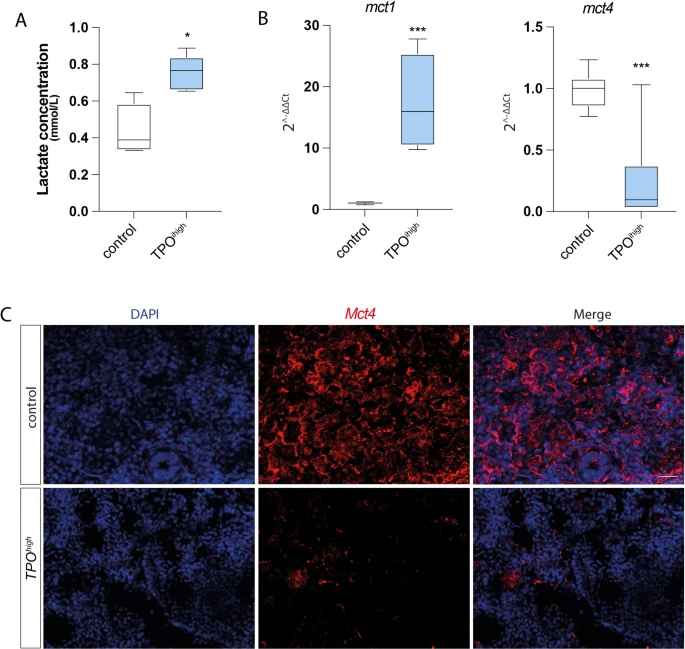
Fig. 5 Alteration of lactate and its transporters in TPOhigh zebrafish model. (A) Evaluation of lactate concentration in WKM from control and TPOhigh zebrafish. (B) qPCR analysis of mct1 and mct4 in WKM from control and TPOhigh animals. (C) Representative immunofluorescence images for Mct4. Scale bar: 20 μm. All the data are presented as means ± SD of three independent experiments. *p < 0.05; ***p < 0.001
Figure Data
Acknowledgments
This image is the copyrighted work of the attributed author or publisher, and
ZFIN has permission only to display this image to its users.
Additional permissions should be obtained from the applicable author or publisher of the image.
Full text @ J Transl Med