
- Title
-
Schwann cells have a limited window of time in which to initiate myelination signaling during early migration in vivo
- Authors
- El-Hage, O., Mikdache, A., Boueid, M.J., Degerny, C., Tawk, M.
- Source
- Full text @ Cells Dev
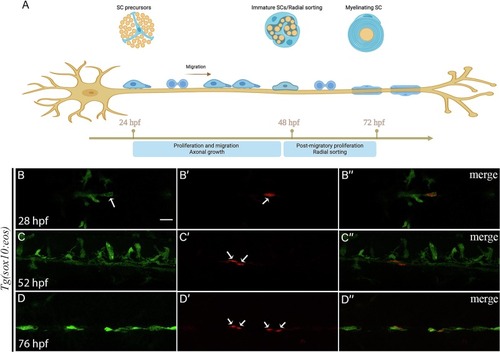
Schwann cells divide during both migration and radial sorting. (A) SCs go through two main rounds of division: i) during migration and ii) during radial sorting. (B–B″) a single SC after photoconversion at 28 hpf (B, B′ white arrows). (C′) two red daughter cells are observed at 52 hpf (white arrows) and four cells at 76 hpf (white arrows in D′). B″, C″ and D″: merge of B and B′, C and C′, D and D′ respectively. Scale bar = 20 μm. |
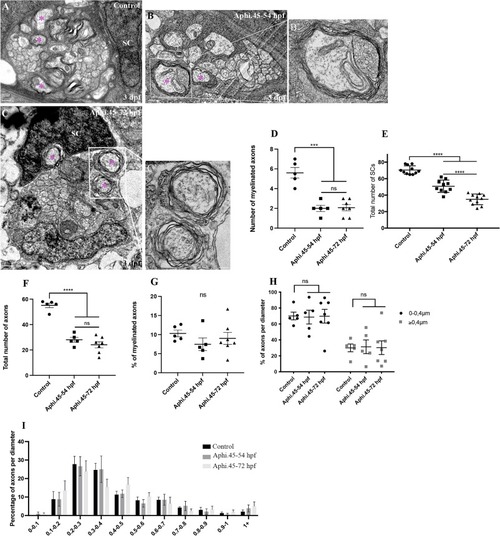
SC division during radial sorting is not required per se for myelination. TEM of a cross section of the PLLn in control (A), 45–54 hpf treated embryo (B) and 45–72 hpf treated embryo (C) at 3 dpf. Scale bars = 0.5 μm. Magenta asterisks represent some large caliber myelinated axons (some are shown at higher magnification in B′ and C′) (scale bars = 0.2 μm). Aphi.: Aphidicolin. (D) Quantification of the number of myelinated axons per nerve at 3 dpf in controls (average of 5.6 ± 0.53, 8 nerves, n = 5 embryos), 45–54 hpf treated embryos (average of 2.00 ± 0.31, 5 nerves, n = 5 embryos), and 45–72 hpf treated embryos (average of 2.07 ± 0.31, 9 nerves, n = 7 embryos) (⁎⁎⁎, p = 0.0009; ns, p = 0.8765). (E) Quantification of the number of SCs within a defined region of the PLLn at 72 hpf in controls (average of 70.4 ± 1.53, n = 11 embryos), 45–54 hpf treated embryos (average of 50.8 ± 2.37, n = 10 embryos), and 45–72 hpf treated embryos (average of 34.9 ± 1.95, n = 11 embryos). (⁎⁎⁎⁎, p ≤ 0.0001). (F) Quantification of the total number of axons per nerve at 3 dpf in controls (average of 55.10 ± 1.81), 45–54 hpf treated embryos (average of 28.00 ± 1.98) and 45–72 hpf treated embryos (average of 24.07 ± 2.04) (⁎⁎⁎⁎, p ≤ 0.0001; ns, p = 0.2356). (G) Quantification of the percentage of myelinated axons relative to the total number of axons per nerve at 3 dpf in controls (average of 10.31 ± 0.87), 45–54 hpf treated embryos (average of 7.46 ± 1.66) and 45–72 hpf treated embryos (average of 9.01 ± 1.57). ns, p > 0.05 in all cases. (H) Quantification of the percentage of axons according to their diameter relative to the total number of axons per nerve at 3 dpf in controls (average of 70.06 for 0–0.4 μm; 29.94 for >0.4 μm), 45–54 hpf treated embryos (average of 68.62 for 0–0.4 μm; 31.38 for >0.4 μm) and 45–72 hpf treated embryos (average of 69.73 for 0–0.4 μm; 30.27 for >0.4 μm). ns, p > 0.05 in all cases. (I) Graph representing the distribution of axons relative to their diameter with 0.1 μm bin width at 3 dpf in controls, 45–54 hpf treated embryos and 45–72 hpf treated embryos. ns, p > 0.05 in all cases. |
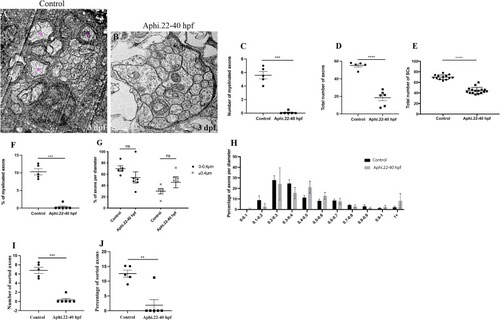
Blocking cell division during migration inhibits peripheral myelination. TEM of a cross section of the PLLn in control (A) and 22–40 hpf treated embryo (B) at 3 dpf. Magenta asterisks represent some large caliber myelinated axons. Scale bars = 0.5 μm. (C) Quantification of the number of myelinated axons per nerve at 3 dpf in controls (average of 5.6 ± 0.53, 8 nerves, n = 5 embryos) and 22–40 hpf treated embryos (average of 0.08 ± 0.08, 8 nerves, n = 6 embryos) (⁎⁎⁎, p = 0.0004). (D) Quantification of the total number of axons per nerve at 3 dpf in controls (average of 55.10 ± 1.81) and 22–40 hpf treated embryos (average of 18.42 ± 3.45) (⁎⁎⁎⁎, p ≤ 0.0001). (E) Quantification of the number of SCs within a defined region of the PLLn at 72 hpf in controls (average of 67.9 ± 1.23, n = 13 embryos), and 22–40 hpf treated embryos (average of 45.4 ± 1.46, n = 16 embryos) (⁎⁎⁎⁎, p ≤ 0.0001). (F) Quantification of the percentage of myelinated axons relative to the total number of axons per nerve at 3 dpf in controls (average of 10.31 ± 0.87) and 22–40 hpf treated embryos (average of 0.30 ± 0.3) (⁎⁎⁎, p = 0.0001). (G) Quantification of the percentage of axons according to their diameter relative to the total number of axons per nerve at 3 dpf in controls (average of 70.06 for 0–0.4 μm; 29.94 for >0.4 μm) and 22–40 hpf treated embryos (average of 54.29 for 0–0.4 μm; 45.71 for >0.4 μm). ns, p = 0.19. (H) Graph representing the distribution of axons relative to their diameter with 0.1 μm bin width at 3 dpf in controls and 22–40 hpf treated embryos. ns, p > 0.05 in all cases. (I) Quantification of the number of sorted axons per nerve at 3 dpf in control (average of 6.80 ± 0.68) and aphidicolin treated embryos between 22 and 40 hpf (average of 0.33 ± 0.3) embryos (⁎⁎⁎, p = 0.0002). (J) Quantification of the percentage of sorted axons per nerve at 3 dpf in control (average of 12.57 ± 1.18) and aphidicolin treated embryos between 22 and 40 hpf (average of 1.87 ± 1.8) (⁎⁎, p = 0.0012). |
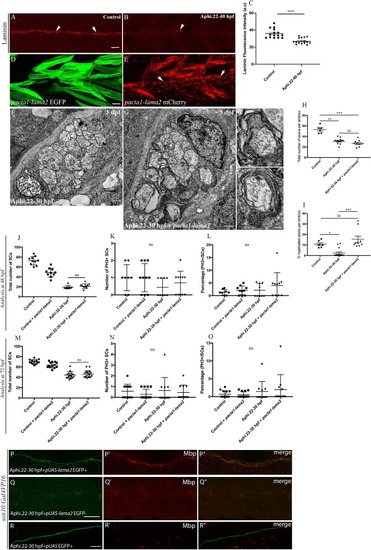
Forcing Laminin expression restores myelination in aphidicolin treated embryos. Laminin expression in a control embryo (A) and treated embryo (B) at 48 hpf showing the PLLn nerve (arrows). Scale bar = 20 μm. (C) Quantification of Laminin fluorescence intensity along the PLLn in control (average of 36 ± 1.4, n = 15) and treated embryos (average of 26.80 ± 0.92, n = 15) at 48 hpf (⁎⁎⁎⁎, p ≤ 0.0001), a.u, arbitrary unit. (D) Lateral view of EGFP expression in muscles surrounding the PLLn at 48 hpf following pacta1-lama2 injection. Scale bar = 20 μm. (E) Lateral view of mCherry-tagged secreted Laminin at 48 hpf in muscles and in the vicinity of the PLLn (white arrows). TEM of a cross section of the PLLn in treated embryo (F) and treated embryo injected with pacta1-lama2 (G). Magenta asterisks represent some large caliber myelinated axons, (some are shown at higher magnification in G',G", scale bars = 0.2 μm). Blue asterisks represent some large caliber non-myelinated axons. Scale bars = 0.5 μm. (H) Quantification of the total number of axons per nerve at 3 dpf in controls (average of 53.33 ± 2.85, 9 nerves, n = 6 embryos), treated embryos (average of 30.77 ± 1.48, 17 nerves, n = 13 embryos) and treated embryos + pacta1-lama2 (average of 26.89 ± 2.51, 9 nerves, n = 9 embryos) (⁎⁎, p = 0.0082; ⁎⁎⁎, p = 0.0003; ns, p = 0.5839). (I) Quantification of the percentage of myelinated axons relative to the total number of axons per nerve at 3 dpf in controls (average of 10.82 ± 1.38), treated embryos (average of 2.22 ± 1.19) and treated embryos + pacta1-lama2 (average of 15.45 ± 3.08) (⁎, p = 0.03; ⁎⁎⁎, p = 0.0004; ns, p > 0.999). (J) Quantification of the number of SCs within a defined region of the PLLn at 48 hpf in controls (average of 72.8 ± 2.71, n = 10 embryos), controls injected with pacta1-lama2 (average of 48.8 ± 2.84, n = 10 embryos), aphidicolin treated embryos between 22 and 30 hpf (average of 19.44 ± 1.10, n = 9 embryos) and aphidicolin treated embryos between 22 and 30 hpf injected with pacta1-lama2 (average of 21 ± 1.49, n = 10 embryos). (ns p > 0.9999). (K) Quantification of the number of PH3+ SCs within a defined region of the PLLn at 48 hpf in controls (average of 1 ± 0.26, n = 8 embryos), controls injected with pacta1-lama2 (average of 1 ± 0.25, n = 10 embryos), aphidicolin treated embryos between 22 and 30 hpf (average of 0.44 ± 0.17, n = 9 embryos) and aphidicolin treated embryos between 22 and 30 hpf and injected with pacta1-lama2 (average of 0.7 ± 0.21, n = 10 embryos). (L) Quantification of the percentage of PH3+ SCs relative to the total number of SCs within a defined region of the PLLn at 48 hpf in controls (average of 1.35 ± 0.38, n = 8 embryos), controls injected with pacta1-lama2 (average of 2.07 ± 0.54, n = 10 embryos), aphidicolin treated embryos between 22 and 30 hpf (average of 2.13 ± 0.86, n = 9 embryos) and aphidicolin treated embryos between 22 and 30 hpf and injected with pacta1-lama2 (average of 4 ± 1.58, n = 10 embryos). (M) Quantification of the number of SCs within a defined region of the PLLn at 72 hpf in controls (average of 69.9 ± 1.16, n = 13 embryos), controls injected with pacta1-lama2 (average of 63.6 ± 1.51, n = 13 embryos), aphidicolin treated embryos between 22 and 30 hpf (average of 44.4 ± 1.58, n = 16 embryos) and aphidicolin treated embryos between 22 and 30 hpf injected with pacta1-lama2 (average of 46 ± 1.68, n = 16 embryos). (ns p = 0.874). (N) Quantification of the number of PH3+ SCs within a defined region of the PLLn at 72 hpf in controls (average of 0.57 ± 0.17, n = 14 embryos), controls injected with pacta1-lama2 (average of 0.28 ± 0.12, n = 14 embryos), aphidicolin treated embryos between 22 and 30 hpf (average of 0.63 ± 0.36, n = 11 embryos) and aphidicolin treated embryos between 22 and 30 hpf and injected with pacta1-lama2 (average of 0.45 ± 0.20, n = 11 embryos). (O) Quantification of the percentage of PH3+ SCs relative to the total number of SCs within a defined region of the PLLn at 72 hpf in controls (average of 0.7 ± 0.27, n = 13 embryos), controls injected with pacta1-lama2 (average of 0.53 ± 0.23, n = 13 embryos), aphidicolin treated embryos between 22 and 30 hpf (average of 1.44 ± 0.8, n = 11 embryos) and aphidicolin treated embryos between 22 and 30 hpf and injected with pacta1-lama2 (average of 1.98 ± 1.25, n = 11 embryos). Lateral view showing EGFP expression in SCs of the PLLn (P) that correlates with normal Mbp expression at 3 dpf (P′) following pUAS-lama2 injection with positive clones of EGFP in sox10:Gal4VP16 22–30 hpf treated embryos, n = 16/16 embryos. P″, merge of P and P′. Scale bar = 20 μm. Lateral view of pUAS-lama2 injected embryos but showing no EGFP expression in SCs of the PLLn (Q) that correlates with a significant decrease in Mbp expression at 3 dpf (Q'), n = 20/20 embryos. Scale bar = 50 μm. Q", merge of Q and Q'. Lateral view of pUAS:EGFP injected/treated embryos showing EGFP expression along the PLLn (R) and a significant decrease in Mbp expression (R'). n = 13/14 embryos. Scale bar = 10 μm. R", merge of R and R'. (For interpretation of the references to colour in this figure legend, the reader is referred to the web version of this article.) |
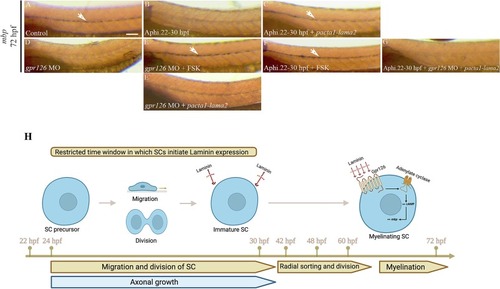
Laminin signals through Gpr126/cAMP to restore myelination in aphidicolin treated embryos. Lateral views of mbp expression at 3 dpf revealed by in situ hybridization along the PLLn in control showing a robust expression (A, n = 32/32), aphidicolin treated embryos showing a sharp decrease in mbp expression (B, n = 30/34), aphidicolin treated embryo and injected with pacta-lama2 (C, n = 37/38) showing a normal mbp expression in clones of SCs. gpr126 morphants show a significant reduction in mbp expression (D, n = 30/32) while those treated with FSK show a normal expression of mbp (E, n = 27/30) similar to embryos treated with aphidicolin and FSK (F, n = 31/33). Gpr126 morphants injected with pacta1-lama2 show a significant reduction in mbp expression (E′, n = 22/26). Embryos treated with aphidicolin and injected with pacta1-lama2 fail to express mbp in the absence of Gpr126 (G, n = 30/34). Arrows indicate SCs expressing mbp along the PLLn. Scale bar = 200 μm. (H) Model of SC development, data strongly suggest a model in which SCs initiate Laminin expression during migration. A gradual increase in the expression level and polymerization of Laminin drives radial sorting and myelination through Gpr126/cAMP signaling at later stages. |

Radial sorting along the anterior-posterior (AP) axis of the PLLn. (A) Lateral view of a 48 hpf embryo. The dotted line represents the AP position of the cross-section analysis by TEM. Anterior is to the left and dorsal to the top. Scale bar = 50 μm. (B) TEM of a cross-section of the PLLn of a WT embryo at 48 hpf. The PLLn is delineated in white dotted lines. Only 2 axons out of 94 (≈2 %) were radially sorted at 48 hpf at this AP position (5 nerves, n = 5 embryos). Scale bar = 0.5 μm. |
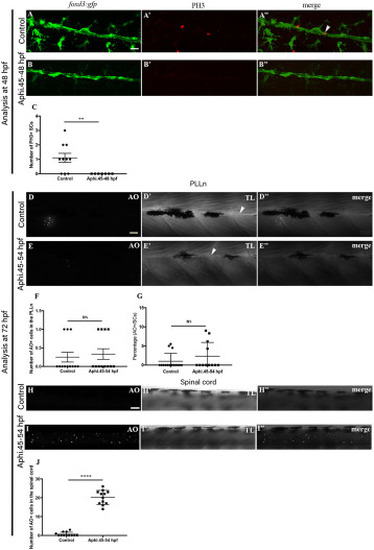
Analysis of PH3+ and acridine orange (AO) + cells in aphidicolin treated embryos during radial sorting. PH3 immunolabeling in Tg(foxd3:gfp) (A–A″) and Tg(foxd3:gfp) embryos treated with aphidicolin between 45 and 48 hpf and analyzed at 48 hpf (B–B″). Arrow in A″ indicates a SC that is GFP and PH3 positive. A″, merge of A and A′; B″, merge of B and B′. Scale bar = 20 μm. (C) Quantification of the number of PH3+ cells within a defined region of the PLLn at 48 hpf in control (average of 1.1 ± 0.31, n = 10) and aphidicolin treated embryos between 45 and 48 hpf (average of 0, n = 7) (⁎⁎, p = 0.0067). Acridine orange staining at 72 hpf in control (D–D″) and aphidicolin treated embryos between 45 and 54 hpf (E–E″) within a defined region of the PLLn. Scale bar = 20 μm. Arrowheads designate the PLLn in D′ and E′. D″, merge of D and D'; E″, merge of E and E′. (F) Quantification of the number of AO positive cells in control (average of 0.25 ± 0.13, n = 12) and embryos treated with aphidicolin between 45 and 54 hpf (average of 0.33 ± 0.19, n = 12) within a defined region of the PLLn (ns, p = 0.67). (G) Quantification of the percentage of AO+ SCs relative to the total number of SCs within a defined region of the PLLn at 72 hpf in controls (average of 1 ± 0.53, n = 15 embryos), and 45–54 hpf treated embryos (average of 2.31 ± 1.03, n = 12 embryos). AO staining at 72 hpf in control (H–H″) and aphidicolin treated embryos between 45 and 54 hpf (I–I″) within a defined region of the spinal cord. H″, merge of H and H′; I″, merge of I and I′. Scale bar = 20 μm. (J) Quantification of the number of AO positive cells in control (average of 0.66 ± 0.31, n = 12) and aphidicolin treated embryos between 45 and 54 hpf (average of 20.17 ± 1.07, n = 12) within a defined region of the spinal cord (⁎⁎⁎⁎, p < 0.0001). TL, transmitted light. |
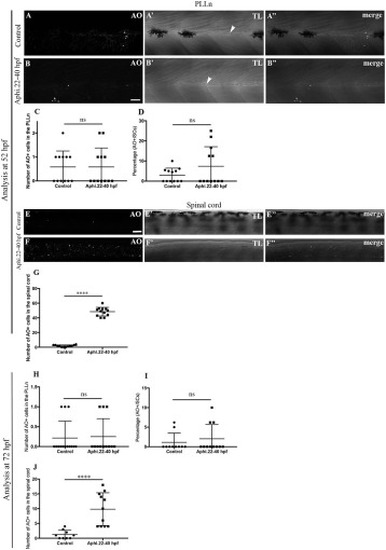
Analysis of AO positive cells in aphidicolin treated embryos during migration. Acridine orange staining at 52 hpf in control (A–A″) and aphidicolin treated embryos between 22 and 40 hpf (B–B″) within a defined region of the PLLn. Scale bar = 20 μm. Arrowheads designate the PLLn in A′ and B′. A″, merge of A and A′; B″, merge of B and B′. (C) Quantification of the number of AO positive cells in control (average of 0.58 ± 0.19, n = 12) and embryos treated with aphidicolin between 22 and 40 hpf (average of 0.59 ± 0.22, n = 12) within a defined region of the PLLn (ns, p > 0.9999). (D) Quantification of the percentage of AO+ SCs relative to the total number of SCs within a defined region of the PLLn at 52 hpf in controls (average of 3 ± 0.99, n = 12 embryos), and 22–40 hpf treated embryos (average of 7.3 ± 2.82, n = 12 embryos). (ns p = 0.157). AO staining at 52 hpf in control (E–E″) and aphidicolin treated embryos between 22 and 40 hpf (F–F″) within a defined region of the spinal cord. E″, merge of E and E′; F″, merge of F and F′. Scale bar = 20 μm. (G) Quantification of the number of AO positive cells in control (average of 1.83 ± 0.38, n = 12) and aphidicolin treated embryos between 22 and 40 hpf (average of 48.42 ± 1.74, n = 12) within a defined region of the spinal cord (⁎⁎⁎⁎, p < 0.0001). TL, transmitted light. (H) Quantification of the number of AO positive cells within a defined region of the PLLn at 72 hpf in control (average of 0.21 ± 0.11, n = 14) and embryos treated with aphidicolin between 22 and 40 hpf (average of 0.25 ± 0.13, n = 12). (ns, p = 0.83). (I) Quantification of the percentage of AO+ SCs relative to the total number of SCs within a defined region of the PLLn at 72 hpf in controls (average of 1.12 ± 0.7, n = 10 embryos), and 22–40 hpf treated embryos (average of 2.03 ± 1.09, n = 11 embryos). (ns, p = 0.5). (J) Quantification of the number of AO positive cells in control (average of 1.22 ± 0.49, n = 9) and aphidicolin treated embryos between 22 and 40 hpf (average of 9.8 ± 1.67, n = 11) within a defined region of the spinal cord (⁎⁎⁎⁎, p < 0.0001). |
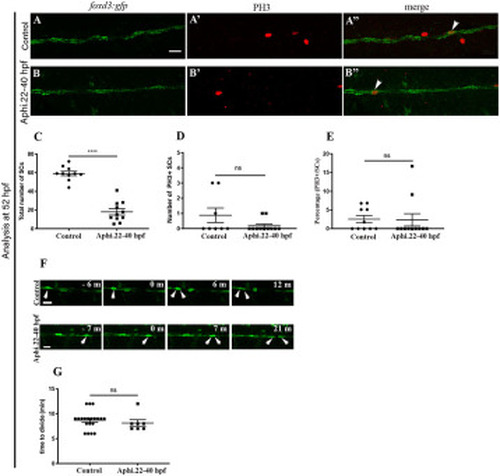
Analysis of SC division during radial sorting in embryos treated with aphidicolin between 22 and 40 hpf. PH3 immunolabeling at 52 hpf in Tg(foxd3:gfp) (A–A″) and Tg(foxd3:gfp) embryos treated with aphidicolin between 22 and 40 hpf (B–B″). Arrow in A″ and B″ indicate SCs that are GFP and PH3 positive. A″, merge of A and A′; B″, merge of B and B′. Scale bar = 20 μm. (C) Quantification of the number of Schwann cells within a defined region of the PLLn at 52 hpf in control (average of 59.10 ± 2.44 cells, n = 10 embryos) and embryos treated with aphidicolin between 22 and 40 hpf (average of 18 ± 3.27 cells, n = 11 embryos) (⁎⁎⁎⁎, p ≤ 0.0001). (D) Quantification of the number of PH3+/Schwann cells within a defined region of the PLLn at 52 hpf in control (average of 0.87 ± 0.47, n = 8 embryos) and embryos treated with aphidicolin between 22 and 40 hpf (average of 0.18 ± 0.12, n = 11 embryos) (ns, p = 0.3265). (E) Quantification of the percentage of PH3+ Schwann cells relative to the total number of Schwann cells within a defined region of the PLLn at 52 hpf in control (average of 2.54 ± 0.95, n = 10 embryos) and embryos treated with aphidicolin between 22 and 40 hpf (average of 2.34 ± 1.65, n = 11 embryos) (ns, p = 0.3274). (F) Still images of time-lapse imaging at 52 hpf in Tg(foxd3:gfp) and Tg(foxd3:gfp) treated with aphidicolin between 22 and 40 hpf embryos. Arrows indicate Schwann cells along the PLLn at different timepoints prior to and after division. Scale bars = 20 μm. (G) Quantification of the time required for control (average of 8.70 ± 0.41 min, 20 cells, n = 5 embryos) and aphidicolin treated embryos between 22 and 40 hpf (average of 8.14 ± 0.67 min, 7 cells, n = 4 embryos) Schwann cells to successfully complete mitotic division during radial sorting. (ns, p = 0.1796). |
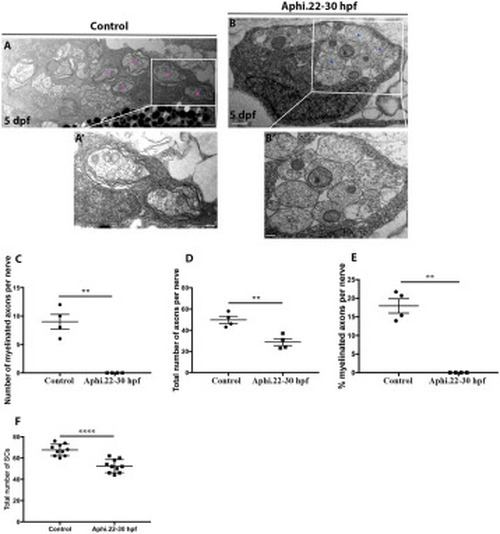
Analysis of the ultrastructure of the PLLn at 5 dpf in aphidicolin treated embryos between 22 and 30 hpf. TEM of a cross section of the PLLn at 5 dpf in control (A) and embryo treated with aphidicolin between 22 and 30 hpf (B). Scale bars = 0.5 μm. Magenta asterisks represent some large caliber myelinated axons. Some large caliber axons are shown at higher magnification in A′ and B′. Scale bars = 0.2 μm. (C) Quantification of the number of myelinated axons per nerve at 5 dpf in controls (average of 9 ± 1.29, 4 nerves, n = 4 embryos) and embryos treated with aphidicolin between 22 and 30 hpf (average of 0, 4 nerves, n = 4 embryos) (⁎⁎, p = 0.0061). (D) Quantification of the total number of axons per nerve at 5 dpf in controls (average of 49.75 ± 3.32) and embryos treated with aphidicolin between 22 and 30 hpf (average of 28.75 ± 3.27) (⁎⁎, p = 0.0041). (E) Quantification of the percentage of myelinated axons relative to the total number of axons per nerve at 5 dpf in controls (average of 17.94 ± 1.92) and embryos treated with aphidicolin between 22 and 30 hpf (average of 0) (⁎⁎, p = 0.0021). (F) Quantification of the number of Schwann cells within a defined region of the PLLn at 5 dpf in control (average of 67.6 ± 1.70 cells, n = 10 embryos) and embryos treated with aphidicolin between 22 and 30 hpf (average of 52.4 ± 1.95 cells, n = 10 embryos) (⁎⁎⁎⁎, p ≤ 0.0001). |