
Fig. 3
- ID
- ZDB-FIG-250403-18
- Publication
- El-Hage et al., 2025 - Schwann cells have a limited window of time in which to initiate myelination signaling during early migration in vivo
- Other Figures
- All Figure Page
- Back to All Figure Page
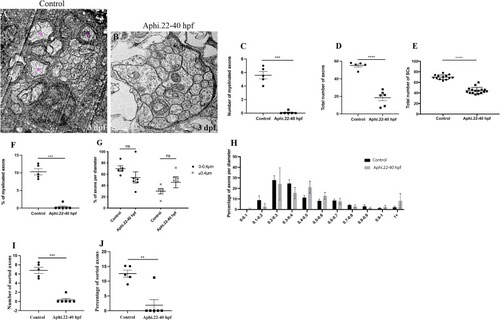
Blocking cell division during migration inhibits peripheral myelination. TEM of a cross section of the PLLn in control (A) and 22–40 hpf treated embryo (B) at 3 dpf. Magenta asterisks represent some large caliber myelinated axons. Scale bars = 0.5 μm. (C) Quantification of the number of myelinated axons per nerve at 3 dpf in controls (average of 5.6 ± 0.53, 8 nerves, n = 5 embryos) and 22–40 hpf treated embryos (average of 0.08 ± 0.08, 8 nerves, n = 6 embryos) (⁎⁎⁎, p = 0.0004). (D) Quantification of the total number of axons per nerve at 3 dpf in controls (average of 55.10 ± 1.81) and 22–40 hpf treated embryos (average of 18.42 ± 3.45) (⁎⁎⁎⁎, p ≤ 0.0001). (E) Quantification of the number of SCs within a defined region of the PLLn at 72 hpf in controls (average of 67.9 ± 1.23, n = 13 embryos), and 22–40 hpf treated embryos (average of 45.4 ± 1.46, n = 16 embryos) (⁎⁎⁎⁎, p ≤ 0.0001). (F) Quantification of the percentage of myelinated axons relative to the total number of axons per nerve at 3 dpf in controls (average of 10.31 ± 0.87) and 22–40 hpf treated embryos (average of 0.30 ± 0.3) (⁎⁎⁎, p = 0.0001). (G) Quantification of the percentage of axons according to their diameter relative to the total number of axons per nerve at 3 dpf in controls (average of 70.06 for 0–0.4 μm; 29.94 for >0.4 μm) and 22–40 hpf treated embryos (average of 54.29 for 0–0.4 μm; 45.71 for >0.4 μm). ns, p = 0.19. (H) Graph representing the distribution of axons relative to their diameter with 0.1 μm bin width at 3 dpf in controls and 22–40 hpf treated embryos. ns, p > 0.05 in all cases. (I) Quantification of the number of sorted axons per nerve at 3 dpf in control (average of 6.80 ± 0.68) and aphidicolin treated embryos between 22 and 40 hpf (average of 0.33 ± 0.3) embryos (⁎⁎⁎, p = 0.0002). (J) Quantification of the percentage of sorted axons per nerve at 3 dpf in control (average of 12.57 ± 1.18) and aphidicolin treated embryos between 22 and 40 hpf (average of 1.87 ± 1.8) (⁎⁎, p = 0.0012). |