
Fig. 2
- ID
- ZDB-FIG-250403-17
- Publication
- El-Hage et al., 2025 - Schwann cells have a limited window of time in which to initiate myelination signaling during early migration in vivo
- Other Figures
- All Figure Page
- Back to All Figure Page
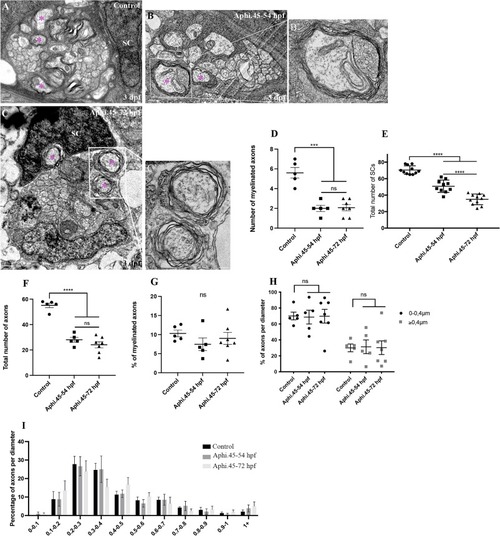
SC division during radial sorting is not required per se for myelination. TEM of a cross section of the PLLn in control (A), 45–54 hpf treated embryo (B) and 45–72 hpf treated embryo (C) at 3 dpf. Scale bars = 0.5 μm. Magenta asterisks represent some large caliber myelinated axons (some are shown at higher magnification in B′ and C′) (scale bars = 0.2 μm). Aphi.: Aphidicolin. (D) Quantification of the number of myelinated axons per nerve at 3 dpf in controls (average of 5.6 ± 0.53, 8 nerves, n = 5 embryos), 45–54 hpf treated embryos (average of 2.00 ± 0.31, 5 nerves, n = 5 embryos), and 45–72 hpf treated embryos (average of 2.07 ± 0.31, 9 nerves, n = 7 embryos) (⁎⁎⁎, p = 0.0009; ns, p = 0.8765). (E) Quantification of the number of SCs within a defined region of the PLLn at 72 hpf in controls (average of 70.4 ± 1.53, n = 11 embryos), 45–54 hpf treated embryos (average of 50.8 ± 2.37, n = 10 embryos), and 45–72 hpf treated embryos (average of 34.9 ± 1.95, n = 11 embryos). (⁎⁎⁎⁎, p ≤ 0.0001). (F) Quantification of the total number of axons per nerve at 3 dpf in controls (average of 55.10 ± 1.81), 45–54 hpf treated embryos (average of 28.00 ± 1.98) and 45–72 hpf treated embryos (average of 24.07 ± 2.04) (⁎⁎⁎⁎, p ≤ 0.0001; ns, p = 0.2356). (G) Quantification of the percentage of myelinated axons relative to the total number of axons per nerve at 3 dpf in controls (average of 10.31 ± 0.87), 45–54 hpf treated embryos (average of 7.46 ± 1.66) and 45–72 hpf treated embryos (average of 9.01 ± 1.57). ns, p > 0.05 in all cases. (H) Quantification of the percentage of axons according to their diameter relative to the total number of axons per nerve at 3 dpf in controls (average of 70.06 for 0–0.4 μm; 29.94 for >0.4 μm), 45–54 hpf treated embryos (average of 68.62 for 0–0.4 μm; 31.38 for >0.4 μm) and 45–72 hpf treated embryos (average of 69.73 for 0–0.4 μm; 30.27 for >0.4 μm). ns, p > 0.05 in all cases. (I) Graph representing the distribution of axons relative to their diameter with 0.1 μm bin width at 3 dpf in controls, 45–54 hpf treated embryos and 45–72 hpf treated embryos. ns, p > 0.05 in all cases. |