
|
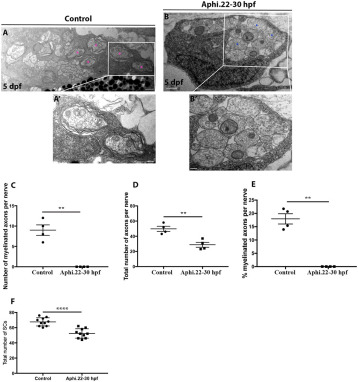
Fig. S5 Analysis of the ultrastructure of the PLLn at 5 dpf in aphidicolin treated embryos between 22 and 30 hpf. TEM of a cross section of the PLLn at 5 dpf in control (A) and embryo treated with aphidicolin between 22 and 30 hpf (B). Scale bars = 0.5 μm. Magenta asterisks represent some large caliber myelinated axons. Some large caliber axons are shown at higher magnification in A′ and B′. Scale bars = 0.2 μm. (C) Quantification of the number of myelinated axons per nerve at 5 dpf in controls (average of 9 ± 1.29, 4 nerves, n = 4 embryos) and embryos treated with aphidicolin between 22 and 30 hpf (average of 0, 4 nerves, n = 4 embryos) (⁎⁎, p = 0.0061). (D) Quantification of the total number of axons per nerve at 5 dpf in controls (average of 49.75 ± 3.32) and embryos treated with aphidicolin between 22 and 30 hpf (average of 28.75 ± 3.27) (⁎⁎, p = 0.0041). (E) Quantification of the percentage of myelinated axons relative to the total number of axons per nerve at 5 dpf in controls (average of 17.94 ± 1.92) and embryos treated with aphidicolin between 22 and 30 hpf (average of 0) (⁎⁎, p = 0.0021). (F) Quantification of the number of Schwann cells within a defined region of the PLLn at 5 dpf in control (average of 67.6 ± 1.70 cells, n = 10 embryos) and embryos treated with aphidicolin between 22 and 30 hpf (average of 52.4 ± 1.95 cells, n = 10 embryos) (⁎⁎⁎⁎, p ≤ 0.0001).