
Fig. S3
- ID
- ZDB-FIG-250403-23
- Publication
- El-Hage et al., 2025 - Schwann cells have a limited window of time in which to initiate myelination signaling during early migration in vivo
- Other Figures
- All Figure Page
- Back to All Figure Page
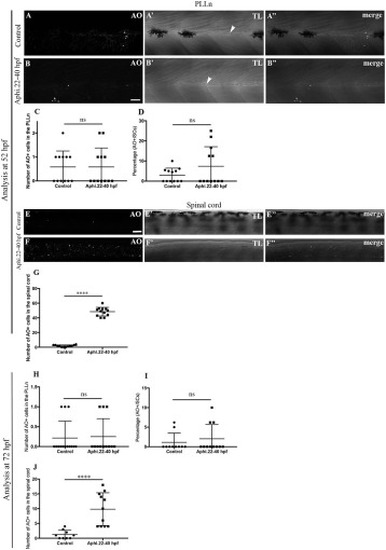
Analysis of AO positive cells in aphidicolin treated embryos during migration. Acridine orange staining at 52 hpf in control (A–A″) and aphidicolin treated embryos between 22 and 40 hpf (B–B″) within a defined region of the PLLn. Scale bar = 20 μm. Arrowheads designate the PLLn in A′ and B′. A″, merge of A and A′; B″, merge of B and B′. (C) Quantification of the number of AO positive cells in control (average of 0.58 ± 0.19, n = 12) and embryos treated with aphidicolin between 22 and 40 hpf (average of 0.59 ± 0.22, n = 12) within a defined region of the PLLn (ns, p > 0.9999). (D) Quantification of the percentage of AO+ SCs relative to the total number of SCs within a defined region of the PLLn at 52 hpf in controls (average of 3 ± 0.99, n = 12 embryos), and 22–40 hpf treated embryos (average of 7.3 ± 2.82, n = 12 embryos). (ns p = 0.157). AO staining at 52 hpf in control (E–E″) and aphidicolin treated embryos between 22 and 40 hpf (F–F″) within a defined region of the spinal cord. E″, merge of E and E′; F″, merge of F and F′. Scale bar = 20 μm. (G) Quantification of the number of AO positive cells in control (average of 1.83 ± 0.38, n = 12) and aphidicolin treated embryos between 22 and 40 hpf (average of 48.42 ± 1.74, n = 12) within a defined region of the spinal cord (⁎⁎⁎⁎, p < 0.0001). TL, transmitted light. (H) Quantification of the number of AO positive cells within a defined region of the PLLn at 72 hpf in control (average of 0.21 ± 0.11, n = 14) and embryos treated with aphidicolin between 22 and 40 hpf (average of 0.25 ± 0.13, n = 12). (ns, p = 0.83). (I) Quantification of the percentage of AO+ SCs relative to the total number of SCs within a defined region of the PLLn at 72 hpf in controls (average of 1.12 ± 0.7, n = 10 embryos), and 22–40 hpf treated embryos (average of 2.03 ± 1.09, n = 11 embryos). (ns, p = 0.5). (J) Quantification of the number of AO positive cells in control (average of 1.22 ± 0.49, n = 9) and aphidicolin treated embryos between 22 and 40 hpf (average of 9.8 ± 1.67, n = 11) within a defined region of the spinal cord (⁎⁎⁎⁎, p < 0.0001). |