
Fig. 4
- ID
- ZDB-FIG-250403-19
- Publication
- El-Hage et al., 2025 - Schwann cells have a limited window of time in which to initiate myelination signaling during early migration in vivo
- Other Figures
- All Figure Page
- Back to All Figure Page
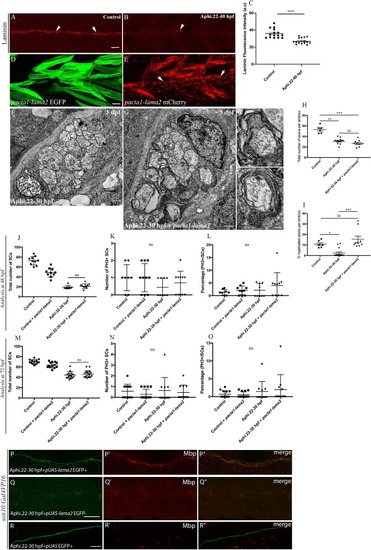
Forcing Laminin expression restores myelination in aphidicolin treated embryos. Laminin expression in a control embryo (A) and treated embryo (B) at 48 hpf showing the PLLn nerve (arrows). Scale bar = 20 μm. (C) Quantification of Laminin fluorescence intensity along the PLLn in control (average of 36 ± 1.4, n = 15) and treated embryos (average of 26.80 ± 0.92, n = 15) at 48 hpf (⁎⁎⁎⁎, p ≤ 0.0001), a.u, arbitrary unit. (D) Lateral view of EGFP expression in muscles surrounding the PLLn at 48 hpf following pacta1-lama2 injection. Scale bar = 20 μm. (E) Lateral view of mCherry-tagged secreted Laminin at 48 hpf in muscles and in the vicinity of the PLLn (white arrows). TEM of a cross section of the PLLn in treated embryo (F) and treated embryo injected with pacta1-lama2 (G). Magenta asterisks represent some large caliber myelinated axons, (some are shown at higher magnification in G',G", scale bars = 0.2 μm). Blue asterisks represent some large caliber non-myelinated axons. Scale bars = 0.5 μm. (H) Quantification of the total number of axons per nerve at 3 dpf in controls (average of 53.33 ± 2.85, 9 nerves, n = 6 embryos), treated embryos (average of 30.77 ± 1.48, 17 nerves, n = 13 embryos) and treated embryos + pacta1-lama2 (average of 26.89 ± 2.51, 9 nerves, n = 9 embryos) (⁎⁎, p = 0.0082; ⁎⁎⁎, p = 0.0003; ns, p = 0.5839). (I) Quantification of the percentage of myelinated axons relative to the total number of axons per nerve at 3 dpf in controls (average of 10.82 ± 1.38), treated embryos (average of 2.22 ± 1.19) and treated embryos + pacta1-lama2 (average of 15.45 ± 3.08) (⁎, p = 0.03; ⁎⁎⁎, p = 0.0004; ns, p > 0.999). (J) Quantification of the number of SCs within a defined region of the PLLn at 48 hpf in controls (average of 72.8 ± 2.71, n = 10 embryos), controls injected with pacta1-lama2 (average of 48.8 ± 2.84, n = 10 embryos), aphidicolin treated embryos between 22 and 30 hpf (average of 19.44 ± 1.10, n = 9 embryos) and aphidicolin treated embryos between 22 and 30 hpf injected with pacta1-lama2 (average of 21 ± 1.49, n = 10 embryos). (ns p > 0.9999). (K) Quantification of the number of PH3+ SCs within a defined region of the PLLn at 48 hpf in controls (average of 1 ± 0.26, n = 8 embryos), controls injected with pacta1-lama2 (average of 1 ± 0.25, n = 10 embryos), aphidicolin treated embryos between 22 and 30 hpf (average of 0.44 ± 0.17, n = 9 embryos) and aphidicolin treated embryos between 22 and 30 hpf and injected with pacta1-lama2 (average of 0.7 ± 0.21, n = 10 embryos). (L) Quantification of the percentage of PH3+ SCs relative to the total number of SCs within a defined region of the PLLn at 48 hpf in controls (average of 1.35 ± 0.38, n = 8 embryos), controls injected with pacta1-lama2 (average of 2.07 ± 0.54, n = 10 embryos), aphidicolin treated embryos between 22 and 30 hpf (average of 2.13 ± 0.86, n = 9 embryos) and aphidicolin treated embryos between 22 and 30 hpf and injected with pacta1-lama2 (average of 4 ± 1.58, n = 10 embryos). (M) Quantification of the number of SCs within a defined region of the PLLn at 72 hpf in controls (average of 69.9 ± 1.16, n = 13 embryos), controls injected with pacta1-lama2 (average of 63.6 ± 1.51, n = 13 embryos), aphidicolin treated embryos between 22 and 30 hpf (average of 44.4 ± 1.58, n = 16 embryos) and aphidicolin treated embryos between 22 and 30 hpf injected with pacta1-lama2 (average of 46 ± 1.68, n = 16 embryos). (ns p = 0.874). (N) Quantification of the number of PH3+ SCs within a defined region of the PLLn at 72 hpf in controls (average of 0.57 ± 0.17, n = 14 embryos), controls injected with pacta1-lama2 (average of 0.28 ± 0.12, n = 14 embryos), aphidicolin treated embryos between 22 and 30 hpf (average of 0.63 ± 0.36, n = 11 embryos) and aphidicolin treated embryos between 22 and 30 hpf and injected with pacta1-lama2 (average of 0.45 ± 0.20, n = 11 embryos). (O) Quantification of the percentage of PH3+ SCs relative to the total number of SCs within a defined region of the PLLn at 72 hpf in controls (average of 0.7 ± 0.27, n = 13 embryos), controls injected with pacta1-lama2 (average of 0.53 ± 0.23, n = 13 embryos), aphidicolin treated embryos between 22 and 30 hpf (average of 1.44 ± 0.8, n = 11 embryos) and aphidicolin treated embryos between 22 and 30 hpf and injected with pacta1-lama2 (average of 1.98 ± 1.25, n = 11 embryos). Lateral view showing EGFP expression in SCs of the PLLn (P) that correlates with normal Mbp expression at 3 dpf (P′) following pUAS-lama2 injection with positive clones of EGFP in sox10:Gal4VP16 22–30 hpf treated embryos, n = 16/16 embryos. P″, merge of P and P′. Scale bar = 20 μm. Lateral view of pUAS-lama2 injected embryos but showing no EGFP expression in SCs of the PLLn (Q) that correlates with a significant decrease in Mbp expression at 3 dpf (Q'), n = 20/20 embryos. Scale bar = 50 μm. Q", merge of Q and Q'. Lateral view of pUAS:EGFP injected/treated embryos showing EGFP expression along the PLLn (R) and a significant decrease in Mbp expression (R'). n = 13/14 embryos. Scale bar = 10 μm. R", merge of R and R'. (For interpretation of the references to colour in this figure legend, the reader is referred to the web version of this article.) |