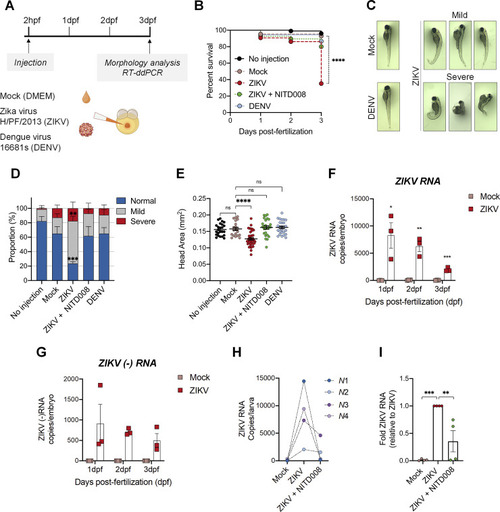
Zika virus replicates efficiently in the zebrafish model and induces morphological defects.

(A) Schematic experimental design. Cell medium (mock), DENV viral particles (serotype 2, strain 16681s) or ZIKV viral particles (strain H/PF/2013) were microinjected in the zebrafish yolk at 2 hours post-fertilization (hpf). This schematic was created with BioRender.com. (B) Survival curve over 3 days post-fertilization (dpf) of mock-infected (n = 84), ZIKV-infected (n = 104), ZIKV-infected and treated with 100 μM NITD008 for the whole period (n = 94), and DENV-infected (n = 89) larvae. (N = 3) **** P ≤ 0.0001. Log-rank test. (C) Representative pictures of microinjected larvae at 3 dpf. ZIKV infection induced both mild and severe developmental phenotypes. (D) Quantification of the proportion of larvae with the different morphological phenotypes illustrated in (C). Visual assessment of zebrafish morphology was done based on the criteria listed in S1A Fig. (No injection, n = 64; Mock, n = 54; ZIKV, n = 67; ZIKV+NITD008 (100 μM), n = 62; DENV, n = 55. N = 3). Data are shown as means ± SEM. *** P ≤ 0.001; ** P ≤ 0.01; 2-way ANOVA. (E) Head size at 3 dpf of the larvae from (D) (No injection, n = 24; Mock, n = 20; ZIKV, n = 38; ZIKV+NITD008 (100 μM), n = 25; DENV, n = 26. N = 3). Data are shown as means ± SEM. **** P ≤ 0.0001; ns = not significant; one-way ANOVA. (F-G) Total ZIKV RNA (F) and ZIKV negative strand (-) RNA (G) levels in whole larvae pools (6–15 larvae) at 1, 2 and 3 dpf were determined using ddPCR. Absolute RNA copies per fish per day post-fertilization are shown. N = 3. Data are means ± SEM. *** P ≤ 0.001; ** P ≤ 0.01; * P ≤ 0.05; Student’s t-test for each day. (H-I) Treatment of ZIKV-infected fish with 100 μM NITD008 decreased the viral load. Viral RNA copies (normalized to the number of larvae) are shown for each independent experiment in (H). Dash lines indicate results from the same independent experiment. In (I), data were normalized to the corresponding ZIKV value for each experiment. Mock, n = 40; ZIKV, n = 40; ZIKV+NITD (100 μM), n = 40. N = 4. Data are shown as means ± SEM. *** P ≤ 0.001; ** P ≤ 0.01; one-way ANOVA. n represents the number of fish; N represents the number of independent experimental repeats.

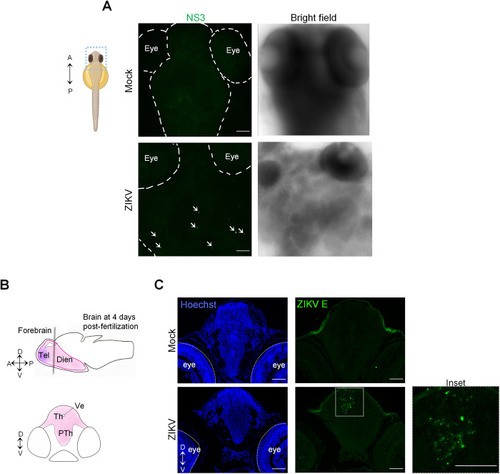
ZIKV injection results in viral protein accumulation in larval brain.

(A) At 3 dpf, mock- and ZIKV-infected larvae were fixed and subjected to whole mount immunostaining with anti-NS3 antibodies. Representative pictures of 4 imaged samples are shown. The arrows indicate specific ZIKV NS3 signals. The schematic representation of the zebrafish larva illustrating the region of interest was created with BioRender.com. A = anterior; P = posterior. (B) Schematic representation of a zebrafish brain at 4 days post-fertilization. The forebrain is shown. The gray line represents the localization of the transverse section. Th and PTh are areas of the diencephalon, a division of the forebrain. Dien = diencephalon; Tel = telencephalon; Th = thalamus; PTh = prethalamus; Ve = ventricle; A = anterior; P = posterior; D = dorsal; V = ventral. (C) Transverse brain cryo-sections of 4 days post-fertilization mock-injected or ZIKV-injected larvae are shown. Sections were stained with anti-ZIKV E antibody (green) and analyzed by confocal microscopy. Nuclei were labeled with Hoechst. Images are maximal intensity projections. Scale bars = 50 μm.

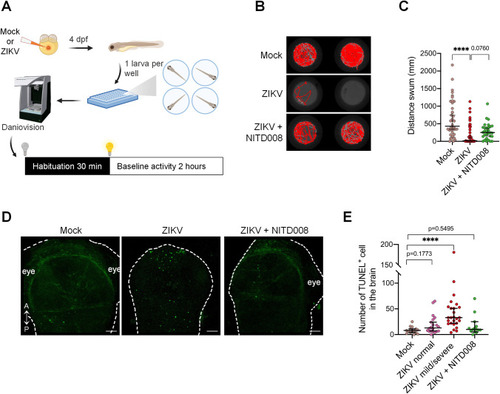
Locomotor defects and brain cell death in developing zebrafish following ZIKV infection.

(A) Schematic experimental setup and behavioral analysis (created with BioRender.com). (B) Representative swimming tracks of control (mock), ZIKV-infected (ZIKV), and ZIKV-infected and NITD008-treated (ZIKV+NITD008 (100 μM)) larvae at 4 days post-fertilization. (C) The distance moved by the larvae was assessed using the DanioVision device (Mock, n = 40; ZIKV, n = 45; ZIKV+NITD008 (100 μM), n = 30. N = 3). Data are shown as median ± 95 CI. **** P ≤ 0.0001; Kruskal-Wallis test. (D) TUNEL staining at 2 days post-fertilization showing cell death in the developing brain following injection in zebrafish embryos. A = anterior; P = posterior. Scale bars = 50 μm. (E) The number of TUNEL+ cells was quantified (Mock, n = 15, N = 3; ZIKV normal, n = 20, N = 3; ZIKV mild/severe, n = 26, N = 3; ZIKV+NITD008 (100 μM), n = 14, N = 2). Data are shown as median ± 95 CI. **** P ≤ 0.0001; Kruskal-Wallis test. n indicates the number of fish; N represents the number of independent experimental repeats.

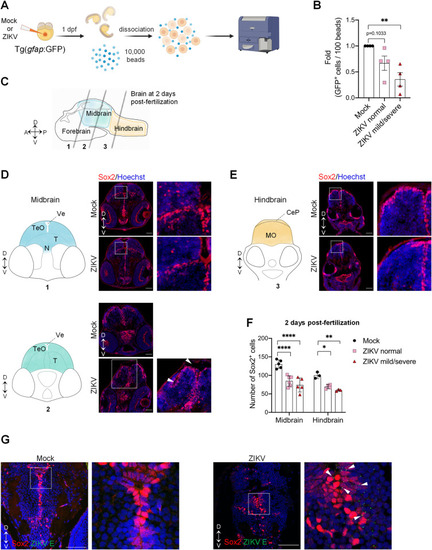
Zika virus targets neural progenitor cells and induces neuropathogenesis in zebrafish larvae.

(A) Schematic experimental design (created with BioRender.com). At 1 day post-fertilization, ZIKV infected or uninfected whole transgenic Tg(gfap:GFP) embryos were dissociated in the presence of 10,000 fluorescent normalizing beads. Single cells and beads were counted by flow cytometry. (B) Relative abundance of GFP+ cells counted per 100 beads (N = 4). Data are shown as means ± SEM. ** P ≤ 0.01; one-way ANOVA. (C) Schematic representation of a zebrafish developing brain at 2 days post-fertilization showing the three areas of the brain: forebrain, midbrain, and hindbrain. The gray lines represent the localization of the transverse sections. D = dorsal; V = ventral; A = anterior; P = posterior. (D-F) Number of neural progenitor cells (Sox2+ cells) in the midbrain (D) and the hindbrain (E) of 2 days post-fertilization mock-injected or ZIKV-injected embryos. TeO, N, and T are areas of the midbrain while MO is an area of the hindbrain. TeO = tectum opticum; T = midbrain tegmentum; N = region of the nucleus of medial longitudinal fascicle; Ve = ventricle; MO = medulla oblongata; CeP: Cerebellar plate. D = dorsal; V = ventral. Data are shown as means ± SEM. **** P ≤ 0.0001; ** P ≤ 0.01; * P ≤ 0.05; Two-way ANOVA. Scale bars = 50 μm. White arrowheads indicate altered midbrain ventricles. (G) Confocal microscopy of brain section from mock-injected and ZIKV-injected embryos at 4 dpf. Cells were co-immunostained with anti-Sox2 and anti-ZIKV E. Cell nuclei were counterstained with Hoechst. Scale bars = 50 μm. White arrowheads indicate E cytoplasmic foci next to Sox2-positive nuclei. These images are representative of 3 analyzed brains. N represents the number of independent experimental repeats.

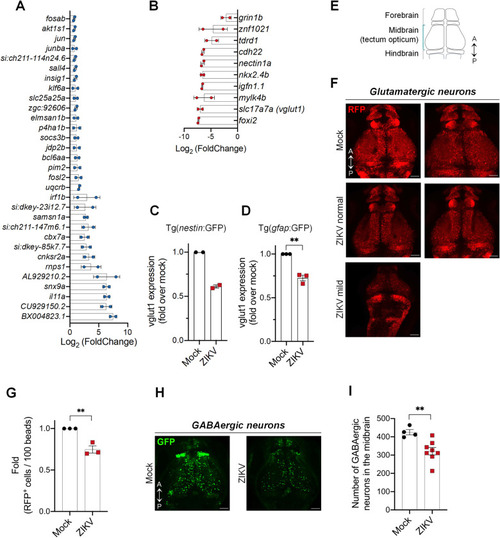
ZIKV infection dysregulates the NPC transcriptome and disrupts the glutamatergic and GABAergic neuronal networks.

(A-B) Tg(nestin:GFP) embryos were infected with ZIKV or mock-injected. At 1 dpf, NPCs (i.e., GFP+ cells) were isolated from whole larvae using FACS. NPC transcriptome was analyzed using RNA sequencing. mRNA expression levels were compared to that of NPCs isolated from uninfected control larvae. The most significantly upregulated (A) and downregulated (B) genes are shown (p < 0.01) (Mock, n = 30; ZIKV, n = 31. N = 2). (C-D) vglut1 gene expression in NPCs isolated from infected larvae, compared to uninfected control larvae, was analyzed by ddPCR. Two transgenic fish lines, Tg(nestin:GFP) (C) and Tg(gfap:GFP) (D), were used. (E) Schematic representation of the dorsal view of the zebrafish brain at 3 dpf showing the three areas: forebrain, midbrain, and hindbrain. A = anterior; P = posterior. (F) Representative images of the glutamatergic neuronal network (RFP+ cells) in the whole brain of control and ZIKV-injected at 3 dpf. Tg(dlx5a/6a:GFP;vglut2:RFP) larval brains were imaged by confocal microcopy. N = 3. Scale bars = 50 μm. (G) Control and ZIKV-injected transgenic larvae Tg(dlx5a/6a:GFP;vglut2:RFP) expressing RFP under the control of the vglut2 promoter (i.e., specifically in glutamatergic neurons) were dissociated at 3 dpf in the presence of 10,000 fluorescent normalizing beads. Single cells and beads were counted by flow cytometry. Number of RFP+ cells per 100 beads were counted (Mock, n = 18; ZIKV, n = 18; N = 3). The relative abundances are shown as means ± SEM. ** P ≤ 0.01; Student’s t-test. (H-I) Representative images of GABAergic neurons (GFP+ cells) in the whole brain of control and ZIKV-injected at 3 dpf. (I) Quantification of the number of GFP-positive cells in the midbrain from images of (H) by manual counting (Mock, n = 4; ZIKV, n = 8; N = 2). Data are shown as means ± SEM. ** P ≤ 0.01; Student’s t-test. Scale bars = 50 μm. n indicates the number of fish; N represents the number of independent experimental repeats.

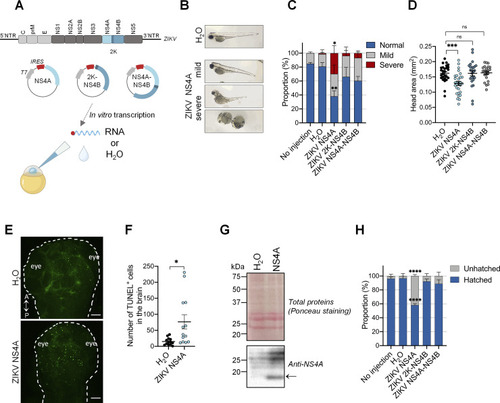
ZIKV NS4A is a major viral determinant in ZIKV pathogenesis in vivo.

(A) Schematic experimental design (created with BioRender.com). ZIKV genome is represented. In vitro transcription was performed on plasmid coding for NS4A, 2K-NS4B, and NS4A-NS4B. NTR = non-translated region; IRES = internal ribosomal entry site. In vitro transcribed NS4A, 2K-NS4B, NS4A-NS4B RNAs were injected at one-cell stage at 1 hour post-fertilization. H2O was used as the reference control. (B) Representative pictures of microinjected larvae at 3 days post-fertilization. NS4A expression induced both mild and severe developmental phenotypes. (C) Proportion of larvae with different phenotypes at 3 days post-fertilization (No injection, n = 68; H2O, n = 53; ZIKV NS4A, n = 62; ZIKV 2K-NS4B, n = 62; ZIKV NS4A-NS4B, n = 63. N = 3). Data are shown as means ± SEM. **** P ≤ 0.0001; ** P ≤ 0.01; * P ≤ 0.05; ns: non-significant; two-way ANOVA. (D) Head area quantification of mock (n = 27), ZIKV NS4A- (n = 29), ZIKV 2K-NS4B- (n = 25) and NS4A-NS4B- (n = 22) injected larvae at 3 days post-fertilization. N = 2. Data are shown as means ± SEM. *** P ≤ 0.001; ns: non-significant; one-way ANOVA. (E-F) TUNEL staining at 2 days post-fertilization (E) and cell death quantification (F) in the developing brain following ZIKV NS4A injection (n = 13) compared to H2O-injected (n = 13) zebrafish embryo. N = 2. A = anterior; P = posterior. Scale bars = 50 μm. * P ≤ 0.05. Student’s t-test. (G) At 1 dpf, 20 larvae injected with either water or NS4A-encoding RNA were pooled and subjected to protein extraction. Resulting samples were analyzed by western blotting using the indicated antibodies. Ponceau staining of total proteins on the membrane is shown as loading control. The arrow indicates the NS4A-specific signal. (H) Hatching rate at 3 days post-fertilization of larvae analyzed in (C). n indicates the number of fish; N represents the number of experimental repeats.

Acknowledgments
This image is the copyrighted work of the attributed author or publisher, and ZFIN has permission only to display this image to its users. Additional permissions should be obtained from the applicable author or publisher of the image. Full text @ PLoS Pathog.