|
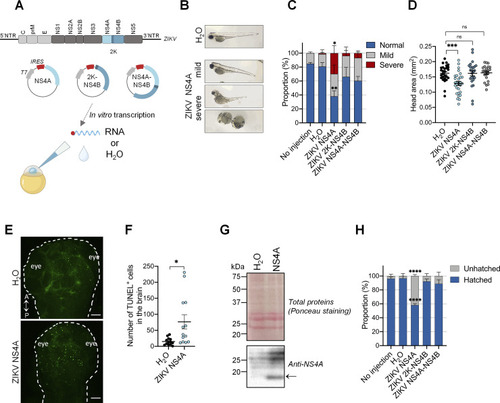
ZIKV NS4A is a major viral determinant in ZIKV pathogenesis in vivo. (A) Schematic experimental design (created with BioRender.com). ZIKV genome is represented. In vitro transcription was performed on plasmid coding for NS4A, 2K-NS4B, and NS4A-NS4B. NTR = non-translated region; IRES = internal ribosomal entry site. In vitro transcribed NS4A, 2K-NS4B, NS4A-NS4B RNAs were injected at one-cell stage at 1 hour post-fertilization. H2O was used as the reference control. (B) Representative pictures of microinjected larvae at 3 days post-fertilization. NS4A expression induced both mild and severe developmental phenotypes. (C) Proportion of larvae with different phenotypes at 3 days post-fertilization (No injection, n = 68; H2O, n = 53; ZIKV NS4A, n = 62; ZIKV 2K-NS4B, n = 62; ZIKV NS4A-NS4B, n = 63. N = 3). Data are shown as means ± SEM. **** P ≤ 0.0001; ** P ≤ 0.01; * P ≤ 0.05; ns: non-significant; two-way ANOVA. (D) Head area quantification of mock (n = 27), ZIKV NS4A- (n = 29), ZIKV 2K-NS4B- (n = 25) and NS4A-NS4B- (n = 22) injected larvae at 3 days post-fertilization. N = 2. Data are shown as means ± SEM. *** P ≤ 0.001; ns: non-significant; one-way ANOVA. (E-F) TUNEL staining at 2 days post-fertilization (E) and cell death quantification (F) in the developing brain following ZIKV NS4A injection (n = 13) compared to H2O-injected (n = 13) zebrafish embryo. N = 2. A = anterior; P = posterior. Scale bars = 50 μm. * P ≤ 0.05. Student’s t-test. (G) At 1 dpf, 20 larvae injected with either water or NS4A-encoding RNA were pooled and subjected to protein extraction. Resulting samples were analyzed by western blotting using the indicated antibodies. Ponceau staining of total proteins on the membrane is shown as loading control. The arrow indicates the NS4A-specific signal. (H) Hatching rate at 3 days post-fertilization of larvae analyzed in (C). n indicates the number of fish; N represents the number of experimental repeats.
|