IMAGE

Fig 5

ID
ZDB-IMAGE-241213-34
Source
Figures for Sow et al., 2024
Image
Figure Caption

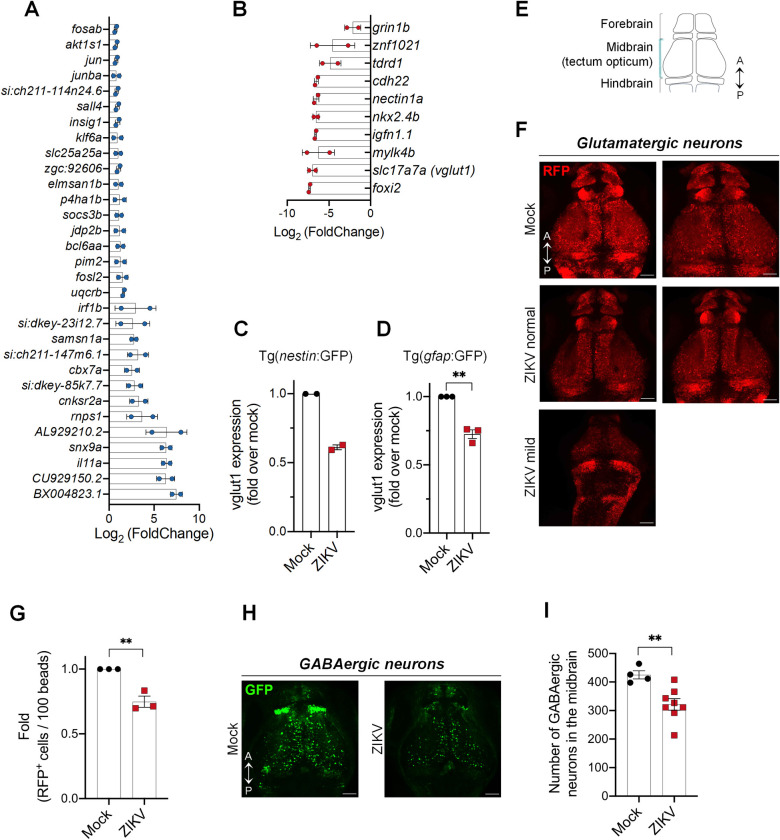
Fig 5 ZIKV infection dysregulates the NPC transcriptome and disrupts the glutamatergic and GABAergic neuronal networks.

(A-B) Tg(nestin:GFP) embryos were infected with ZIKV or mock-injected. At 1 dpf, NPCs (i.e., GFP+ cells) were isolated from whole larvae using FACS. NPC transcriptome was analyzed using RNA sequencing. mRNA expression levels were compared to that of NPCs isolated from uninfected control larvae. The most significantly upregulated (A) and downregulated (B) genes are shown (p < 0.01) (Mock, n = 30; ZIKV, n = 31. N = 2). (C-D) vglut1 gene expression in NPCs isolated from infected larvae, compared to uninfected control larvae, was analyzed by ddPCR. Two transgenic fish lines, Tg(nestin:GFP) (C) and Tg(gfap:GFP) (D), were used. (E) Schematic representation of the dorsal view of the zebrafish brain at 3 dpf showing the three areas: forebrain, midbrain, and hindbrain. A = anterior; P = posterior. (F) Representative images of the glutamatergic neuronal network (RFP+ cells) in the whole brain of control and ZIKV-injected at 3 dpf. Tg(dlx5a/6a:GFP;vglut2:RFP) larval brains were imaged by confocal microcopy. N = 3. Scale bars = 50 μm. (G) Control and ZIKV-injected transgenic larvae Tg(dlx5a/6a:GFP;vglut2:RFP) expressing RFP under the control of the vglut2 promoter (i.e., specifically in glutamatergic neurons) were dissociated at 3 dpf in the presence of 10,000 fluorescent normalizing beads. Single cells and beads were counted by flow cytometry. Number of RFP+ cells per 100 beads were counted (Mock, n = 18; ZIKV, n = 18; N = 3). The relative abundances are shown as means ± SEM. ** P ≤ 0.01; Student’s t-test. (H-I) Representative images of GABAergic neurons (GFP+ cells) in the whole brain of control and ZIKV-injected at 3 dpf. (I) Quantification of the number of GFP-positive cells in the midbrain from images of (H) by manual counting (Mock, n = 4; ZIKV, n = 8; N = 2). Data are shown as means ± SEM. ** P ≤ 0.01; Student’s t-test. Scale bars = 50 μm. n indicates the number of fish; N represents the number of independent experimental repeats.

Acknowledgments
This image is the copyrighted work of the attributed author or publisher, and ZFIN has permission only to display this image to its users. Additional permissions should be obtained from the applicable author or publisher of the image. Full text @ PLoS Pathog.