|
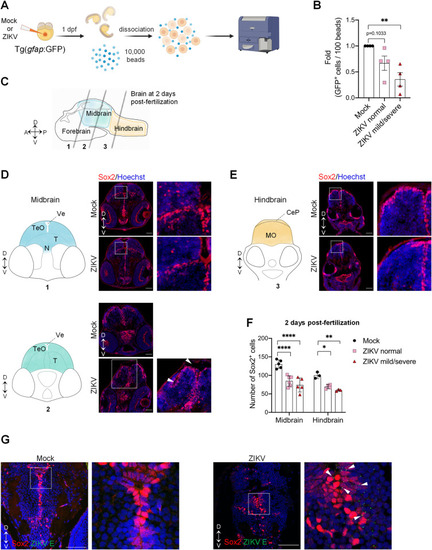
Zika virus targets neural progenitor cells and induces neuropathogenesis in zebrafish larvae. (A) Schematic experimental design (created with BioRender.com). At 1 day post-fertilization, ZIKV infected or uninfected whole transgenic Tg(gfap:GFP) embryos were dissociated in the presence of 10,000 fluorescent normalizing beads. Single cells and beads were counted by flow cytometry. (B) Relative abundance of GFP+ cells counted per 100 beads (N = 4). Data are shown as means ± SEM. ** P ≤ 0.01; one-way ANOVA. (C) Schematic representation of a zebrafish developing brain at 2 days post-fertilization showing the three areas of the brain: forebrain, midbrain, and hindbrain. The gray lines represent the localization of the transverse sections. D = dorsal; V = ventral; A = anterior; P = posterior. (D-F) Number of neural progenitor cells (Sox2+ cells) in the midbrain (D) and the hindbrain (E) of 2 days post-fertilization mock-injected or ZIKV-injected embryos. TeO, N, and T are areas of the midbrain while MO is an area of the hindbrain. TeO = tectum opticum; T = midbrain tegmentum; N = region of the nucleus of medial longitudinal fascicle; Ve = ventricle; MO = medulla oblongata; CeP: Cerebellar plate. D = dorsal; V = ventral. Data are shown as means ± SEM. **** P ≤ 0.0001; ** P ≤ 0.01; * P ≤ 0.05; Two-way ANOVA. Scale bars = 50 μm. White arrowheads indicate altered midbrain ventricles. (G) Confocal microscopy of brain section from mock-injected and ZIKV-injected embryos at 4 dpf. Cells were co-immunostained with anti-Sox2 and anti-ZIKV E. Cell nuclei were counterstained with Hoechst. Scale bars = 50 μm. White arrowheads indicate E cytoplasmic foci next to Sox2-positive nuclei. These images are representative of 3 analyzed brains. N represents the number of independent experimental repeats.
|