FIGURE

Fig 3

ID
ZDB-FIG-241213-32
Publication
Sow et al., 2024 - A zebrafish-based in vivo model of Zika virus infection unveils alterations of the glutamatergic neuronal development and NS4A as a key viral determinant of neuropathogenesis
Other Figures
All Figure Page
Back to All Figure Page
Fig 3

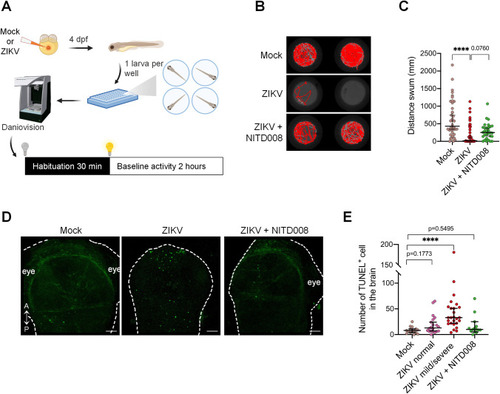
Locomotor defects and brain cell death in developing zebrafish following ZIKV infection.

(A) Schematic experimental setup and behavioral analysis (created with BioRender.com). (B) Representative swimming tracks of control (mock), ZIKV-infected (ZIKV), and ZIKV-infected and NITD008-treated (ZIKV+NITD008 (100 μM)) larvae at 4 days post-fertilization. (C) The distance moved by the larvae was assessed using the DanioVision device (Mock, n = 40; ZIKV, n = 45; ZIKV+NITD008 (100 μM), n = 30. N = 3). Data are shown as median ± 95 CI. **** P ≤ 0.0001; Kruskal-Wallis test. (D) TUNEL staining at 2 days post-fertilization showing cell death in the developing brain following injection in zebrafish embryos. A = anterior; P = posterior. Scale bars = 50 μm. (E) The number of TUNEL+ cells was quantified (Mock, n = 15, N = 3; ZIKV normal, n = 20, N = 3; ZIKV mild/severe, n = 26, N = 3; ZIKV+NITD008 (100 μM), n = 14, N = 2). Data are shown as median ± 95 CI. **** P ≤ 0.0001; Kruskal-Wallis test. n indicates the number of fish; N represents the number of independent experimental repeats.

Expression Data

Expression Detail
Antibody Labeling
Phenotype Data

Phenotype Detail
Acknowledgments
This image is the copyrighted work of the attributed author or publisher, and ZFIN has permission only to display this image to its users. Additional permissions should be obtained from the applicable author or publisher of the image. Full text @ PLoS Pathog.