|
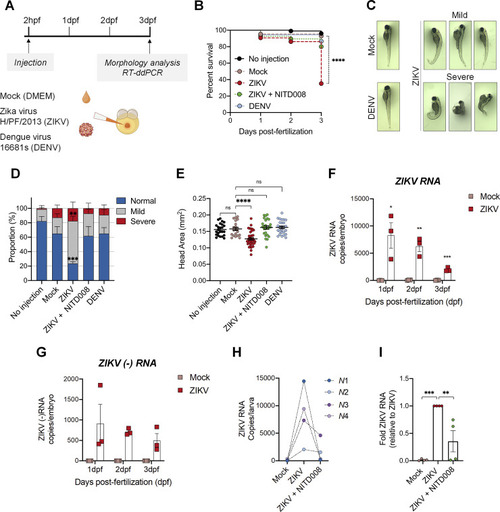
Zika virus replicates efficiently in the zebrafish model and induces morphological defects. (A) Schematic experimental design. Cell medium (mock), DENV viral particles (serotype 2, strain 16681s) or ZIKV viral particles (strain H/PF/2013) were microinjected in the zebrafish yolk at 2 hours post-fertilization (hpf). This schematic was created with BioRender.com. (B) Survival curve over 3 days post-fertilization (dpf) of mock-infected (n = 84), ZIKV-infected (n = 104), ZIKV-infected and treated with 100 μM NITD008 for the whole period (n = 94), and DENV-infected (n = 89) larvae. (N = 3) **** P ≤ 0.0001. Log-rank test. (C) Representative pictures of microinjected larvae at 3 dpf. ZIKV infection induced both mild and severe developmental phenotypes. (D) Quantification of the proportion of larvae with the different morphological phenotypes illustrated in (C). Visual assessment of zebrafish morphology was done based on the criteria listed in S1A Fig. (No injection, n = 64; Mock, n = 54; ZIKV, n = 67; ZIKV+NITD008 (100 μM), n = 62; DENV, n = 55. N = 3). Data are shown as means ± SEM. *** P ≤ 0.001; ** P ≤ 0.01; 2-way ANOVA. (E) Head size at 3 dpf of the larvae from (D) (No injection, n = 24; Mock, n = 20; ZIKV, n = 38; ZIKV+NITD008 (100 μM), n = 25; DENV, n = 26. N = 3). Data are shown as means ± SEM. **** P ≤ 0.0001; ns = not significant; one-way ANOVA. (F-G) Total ZIKV RNA (F) and ZIKV negative strand (-) RNA (G) levels in whole larvae pools (6–15 larvae) at 1, 2 and 3 dpf were determined using ddPCR. Absolute RNA copies per fish per day post-fertilization are shown. N = 3. Data are means ± SEM. *** P ≤ 0.001; ** P ≤ 0.01; * P ≤ 0.05; Student’s t-test for each day. (H-I) Treatment of ZIKV-infected fish with 100 μM NITD008 decreased the viral load. Viral RNA copies (normalized to the number of larvae) are shown for each independent experiment in (H). Dash lines indicate results from the same independent experiment. In (I), data were normalized to the corresponding ZIKV value for each experiment. Mock, n = 40; ZIKV, n = 40; ZIKV+NITD (100 μM), n = 40. N = 4. Data are shown as means ± SEM. *** P ≤ 0.001; ** P ≤ 0.01; one-way ANOVA. n represents the number of fish; N represents the number of independent experimental repeats.
|