FIGURE

Fig 2

ID
ZDB-FIG-241213-31
Publication
Sow et al., 2024 - A zebrafish-based in vivo model of Zika virus infection unveils alterations of the glutamatergic neuronal development and NS4A as a key viral determinant of neuropathogenesis
Other Figures
All Figure Page
Back to All Figure Page
Fig 2

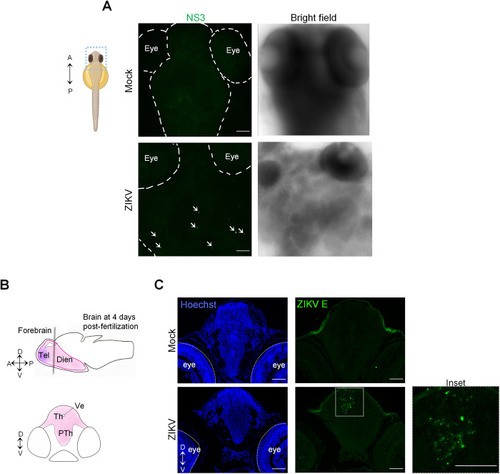
ZIKV injection results in viral protein accumulation in larval brain.

(A) At 3 dpf, mock- and ZIKV-infected larvae were fixed and subjected to whole mount immunostaining with anti-NS3 antibodies. Representative pictures of 4 imaged samples are shown. The arrows indicate specific ZIKV NS3 signals. The schematic representation of the zebrafish larva illustrating the region of interest was created with BioRender.com. A = anterior; P = posterior. (B) Schematic representation of a zebrafish brain at 4 days post-fertilization. The forebrain is shown. The gray line represents the localization of the transverse section. Th and PTh are areas of the diencephalon, a division of the forebrain. Dien = diencephalon; Tel = telencephalon; Th = thalamus; PTh = prethalamus; Ve = ventricle; A = anterior; P = posterior; D = dorsal; V = ventral. (C) Transverse brain cryo-sections of 4 days post-fertilization mock-injected or ZIKV-injected larvae are shown. Sections were stained with anti-ZIKV E antibody (green) and analyzed by confocal microscopy. Nuclei were labeled with Hoechst. Images are maximal intensity projections. Scale bars = 50 μm.

Expression Data

Expression Detail
Antibody Labeling
Phenotype Data

Phenotype Detail
Acknowledgments
This image is the copyrighted work of the attributed author or publisher, and ZFIN has permission only to display this image to its users. Additional permissions should be obtained from the applicable author or publisher of the image. Full text @ PLoS Pathog.