
- Title
-
Transcriptional profiling of zebrafish intestines identifies macrophages as host cells for human norovirus infection
- Authors
- Roux, E., Willms, R.J., Van Dycke, J., Cortes Calabuig, Á., Van Espen, L., Schoofs, G., Matthijnssens, J., Neyts, J., de Witte, P., Foley, E., Rocha-Pereira, J.
- Source
- Full text @ Gut Microbes
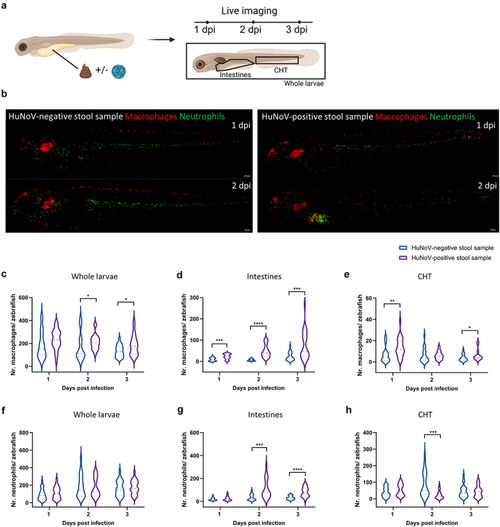
Upon HuNoV infection macrophages expand and are attracted to the intestines. (a) A schematic overview illustrating the experimental setup where zebrafish larvae were injected with either a HuNoV-negative or -positive stool sample, followed by live imaging at 1, 2, and 3 dpi. (b) Representative fluorescent images (10X magnification) of zebrafish larvae from the transgenic line Tg(fms:Gal4/UAS:nfsB:mCherry/mpx:GFP) injected with HuNoV-negative or -positive stool samples. The images show the recruitment of macrophages (red) and neutrophils (green) to the intestinal region where HuNoV infection occurs. Images were deconvoluted using leica LAS X imaging software. (c-e) quantification of macrophages in (c) whole larvae, (d) intestines, and (e) the caudal hematopoietic tissue (CHT) using ImageJ, in zebrafish injected with either a HuNoV-negative or positive stool sample. (f-h) quantification of neutrophils in (f) whole larvae, (g) intestines, and (h) the CHT using ImageJ, in zebrafish injected with either a HuNoVnegative or -positive stool sample. For panels (c-h), data from 22-24 larvae per condition are shown as violin plots with medians, with outliers removed (ROUT, Q = 1%). Statistical analysis was performed using the Mann-Whitney test, with significant differences marked by asterisks: * |
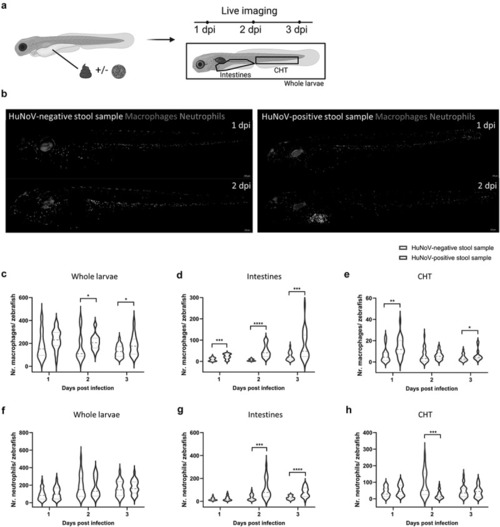
Upon HuNoV infection macrophages expand and are attracted to the intestines. (a) A schematic overview illustrating the experimental setup where zebrafish larvae were injected with either a HuNoV-negative or -positive stool sample, followed by live imaging at 1, 2, and 3 dpi. (b) Representative fluorescent images (10X magnification) of zebrafish larvae from the transgenic line Tg(fms:Gal4/UAS:nfsB:mCherry/mpx:GFP) injected with HuNoV-negative or -positive stool samples. The images show the recruitment of macrophages (red) and neutrophils (green) to the intestinal region where HuNoV infection occurs. Images were deconvoluted using leica LAS X imaging software. (c-e) quantification of macrophages in (c) whole larvae, (d) intestines, and (e) the caudal hematopoietic tissue (CHT) using ImageJ, in zebrafish injected with either a HuNoV-negative or positive stool sample. (f-h) quantification of neutrophils in (f) whole larvae, (g) intestines, and (h) the CHT using ImageJ, in zebrafish injected with either a HuNoVnegative or -positive stool sample. For panels (c-h), data from 22-24 larvae per condition are shown as violin plots with medians, with outliers removed (ROUT, Q = 1%). Statistical analysis was performed using the Mann-Whitney test, with significant differences marked by asterisks: * |
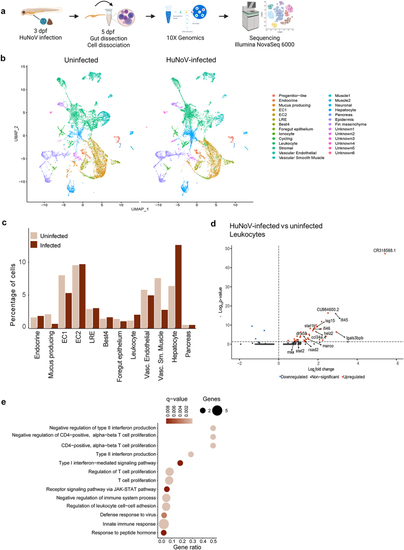
A scRNA-seq analysis on dissected zebrafish larval intestines shows an increase in leukocytes and an important role in the antiviral immune response. (a) Experimental design for transcriptional profiling of single cells in the zebrafish intestine. (b) Aggregated data of all intestinal cells ( |
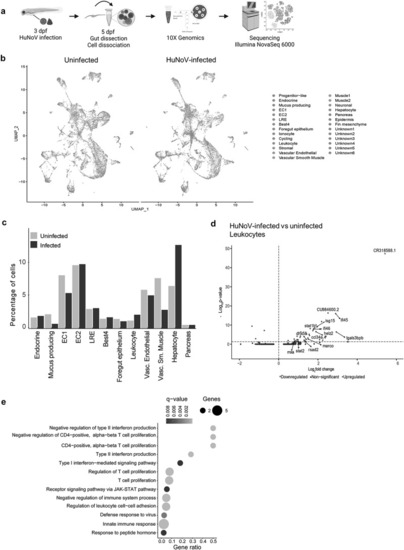
A scRNA-seq analysis on dissected zebrafish larval intestines shows an increase in leukocytes and an important role in the antiviral immune response. (a) Experimental design for transcriptional profiling of single cells in the zebrafish intestine. (b) Aggregated data of all intestinal cells ( |
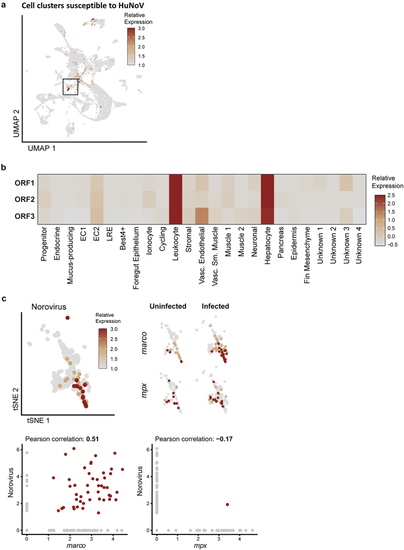
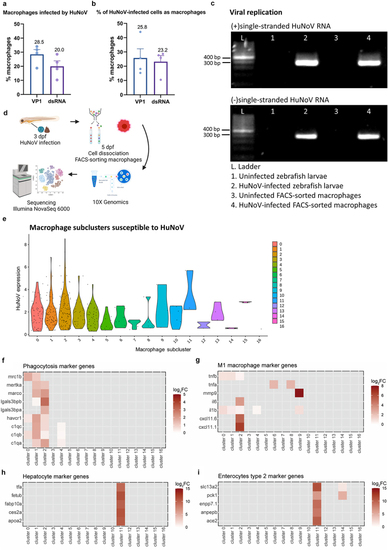
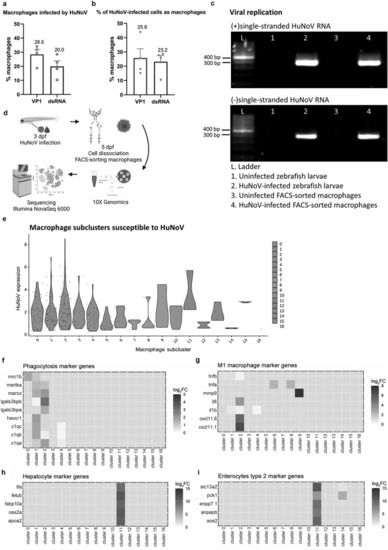
ScRNA-seq identifies enterocytes, hepatocytes, and leukocytes as host cells for HuNoV infection in the zebrafish intestines. (a) Cell clusters susceptible to HuNoV infection are highlighted and included leukocytes marked with a black box. (b) The relative expression levels of HuNoV’s ORF 1, 2, and 3 (respectively encoding for the non-structural polyprotein, VP1, and VP2) in different cell clusters are shown in detail and highlight a tropism particular for leukocytes. The average expression of each norovirus read per cell type was determined followed by a normalization across all cell types. (c) Within leukocytes, a 2D t-SNE projection of the leukocyte cell cluster shows the relative expression of HuNoV. Within leukocytes, the expression of |
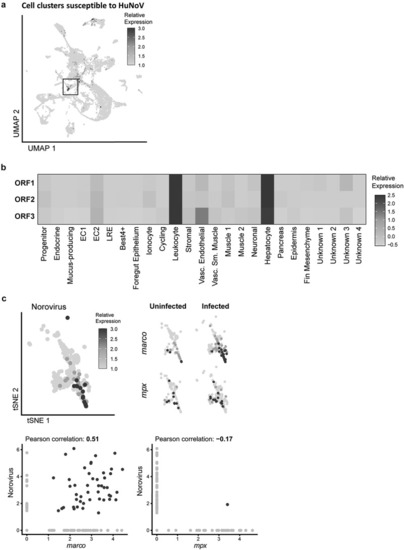
ScRNA-seq identifies enterocytes, hepatocytes, and leukocytes as host cells for HuNoV infection in the zebrafish intestines. (a) Cell clusters susceptible to HuNoV infection are highlighted and included leukocytes marked with a black box. (b) The relative expression levels of HuNoV’s ORF 1, 2, and 3 (respectively encoding for the non-structural polyprotein, VP1, and VP2) in different cell clusters are shown in detail and highlight a tropism particular for leukocytes. The average expression of each norovirus read per cell type was determined followed by a normalization across all cell types. (c) Within leukocytes, a 2D t-SNE projection of the leukocyte cell cluster shows the relative expression of HuNoV. Within leukocytes, the expression of |
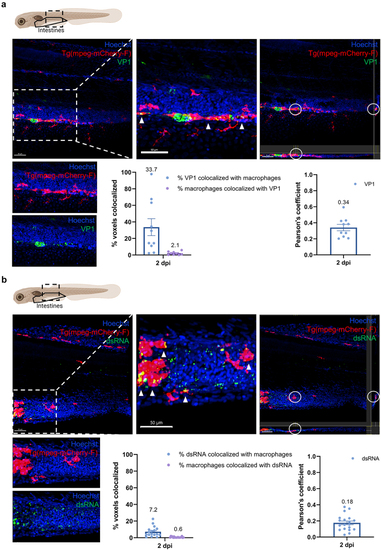
Macrophages in the intestines are infected by HuNoV and allow active viral replication. (a-b) whole mount immunohistochemistry confocal images of Tg(mpeg:mCherry-F) zebrafish larvae infected with HuNoV taken at 2 dpi at a 25X magnification focusing on the intestines using Hoechst, a primary mCherry antibody, and (a) a VP1-targeting antibody or (b) a dsRNA-targeting antibody. Cross-section views created in imaris software show horizontal and vertical sections of macrophages that contain (a) VP1 or (b) dsRNA with the white circle highlighting an infected cell of interest. Imaris 3D Colocalization software calculated the overlap of voxels between macrophages and (a) VP1 or (b) dsRNA ( |
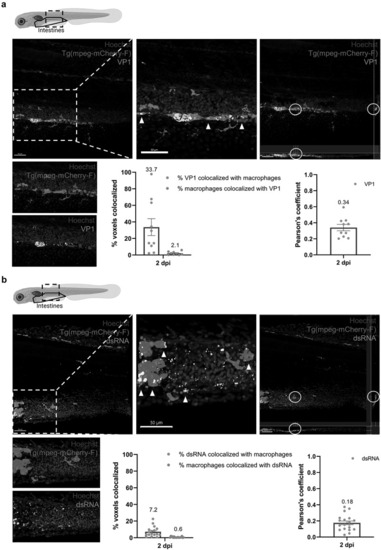
Macrophages in the intestines are infected by HuNoV and allow active viral replication. (a-b) whole mount immunohistochemistry confocal images of Tg(mpeg:mCherry-F) zebrafish larvae infected with HuNoV taken at 2 dpi at a 25X magnification focusing on the intestines using Hoechst, a primary mCherry antibody, and (a) a VP1-targeting antibody or (b) a dsRNA-targeting antibody. Cross-section views created in imaris software show horizontal and vertical sections of macrophages that contain (a) VP1 or (b) dsRNA with the white circle highlighting an infected cell of interest. Imaris 3D Colocalization software calculated the overlap of voxels between macrophages and (a) VP1 or (b) dsRNA ( |
The |
The |
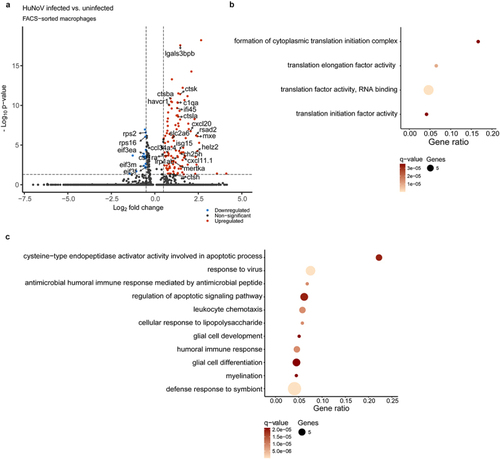
Single-cell analysis reveals inhibition of cytoplasmic translation and enhanced phagocytosis in HuNoV-infected macrophages. (a) A volcano plot shows the DEGs in HuNoV-infected vs. uninfected bystander macrophages within the HuNoV-infected zebrafish host. A vertical dotted line marks a log2(fold change) value of 0.5, while the horizontal dotted line marks a benjamini-Hochberg q-value of 0.05. Dot plot showing the pathways obtained via a ClueGO hypergeometric enrichment pathway analysis of (b) downregulated and (c) upregulated DEGs using the gene ontology - biological process database. HuNoV = human norovirus, DEGs = differentially expressed genes. |
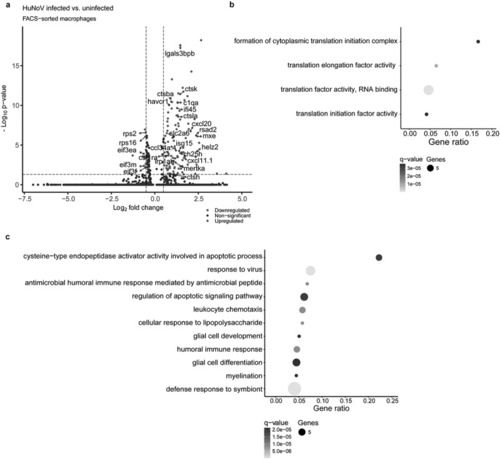
Single-cell analysis reveals inhibition of cytoplasmic translation and enhanced phagocytosis in HuNoV-infected macrophages. (a) A volcano plot shows the DEGs in HuNoV-infected vs. uninfected bystander macrophages within the HuNoV-infected zebrafish host. A vertical dotted line marks a log2(fold change) value of 0.5, while the horizontal dotted line marks a benjamini-Hochberg q-value of 0.05. Dot plot showing the pathways obtained via a ClueGO hypergeometric enrichment pathway analysis of (b) downregulated and (c) upregulated DEGs using the gene ontology - biological process database. HuNoV = human norovirus, DEGs = differentially expressed genes. |
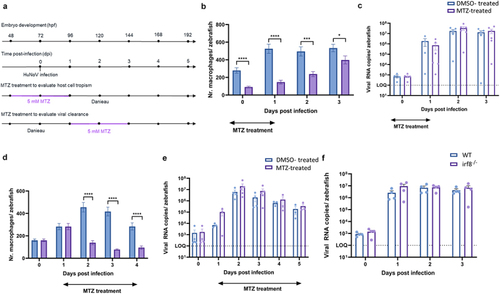
Macrophages are not crucial for either viral replication or viral clearance. (a) Graphical presentation of MTZ treatment schedule before and after infection. (b, d) bars represent the number of macrophages per zebrafish larva of Tg(mpeg1:Gal4/UAS:nfsB-mCherry) quantified using ImageJ software when larvae are treated with DMSO or MTZ to induce chemical ablation of macrophages. |
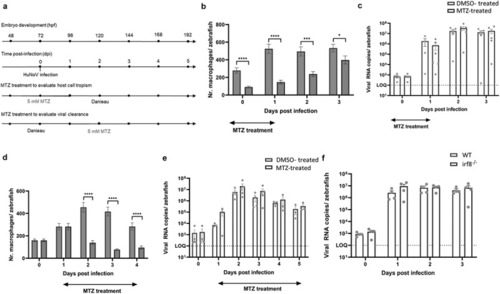
Macrophages are not crucial for either viral replication or viral clearance. (a) Graphical presentation of MTZ treatment schedule before and after infection. (b, d) bars represent the number of macrophages per zebrafish larva of Tg(mpeg1:Gal4/UAS:nfsB-mCherry) quantified using ImageJ software when larvae are treated with DMSO or MTZ to induce chemical ablation of macrophages. |