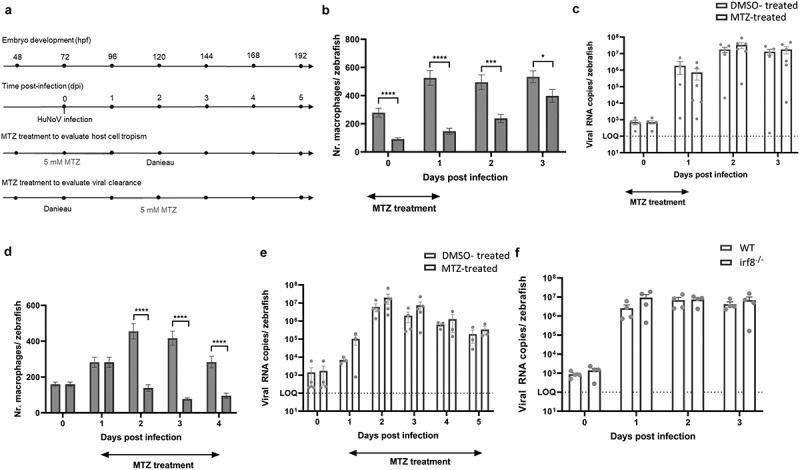
IMAGE

Figure 7.

ID
ZDB-IMAGE-241127-33
Source
Figures for Roux et al., 2024
Image
Figure Caption

Figure 7.

Macrophages are not crucial for either viral replication or viral clearance. (a) Graphical presentation of MTZ treatment schedule before and after infection. (b, d) bars represent the number of macrophages per zebrafish larva of Tg(mpeg1:Gal4/UAS:nfsB-mCherry) quantified using ImageJ software when larvae are treated with DMSO or MTZ to induce chemical ablation of macrophages. N = 18-29 zebrafish larvae per group. (c, e) bars represent HuNoV viral RNA copies per zebrafish larva quantified using RT-qPCR. N = 3-5 independent experiments with 10 zebrafish larvae per group. (b-e) mean values ± SEM are shown. The dotted line shows the LOQ. (f) Bars represent HuNoV viral RNA copies per WT or irf8−/− zebrafish larva using RT-qPCR. N = 4 independent experiments with 10 zebrafish larvae per group, mean values ± SEM are shown. The dotted line shows the LOQ. For all graphs: outliers were removed (ROUT, Q = 1%). Statistical analysis was performed using the Mann-Whitney test. Significantly different values are indicated by asterisks; *p < 0.05, ***p < 0.001, ****p < 0.0001. (b) Before HuNoV infection, MTZ treatment reduced macrophage numbers by 67% (p < 0.0001) at 0 dpi, by 72% (p < 0.0001) at 1 dpi, by 52% (p = 0.0003) at 2 dpi, and by 25% (p = 0.0449) at 3 dpi. (d) After HuNoV infection, MTZ treatment reduced macrophage numbers by 70% (p < 0.0001) at 2 dpi, by 82% (p < 0.0001) at 3 dpi, and by 67% (p < 0.0001) at 4 dpi. MTZ = metronidazole, DMSO = dimethylsulfoxide, HuNoV = human norovirus, hpf = hours post fertilization, dpi = days post infection, WT = wildtype, KO = knockout, SEM = standard error of means, LOQ = limit of quantification.

Acknowledgments
This image is the copyrighted work of the attributed author or publisher, and ZFIN has permission only to display this image to its users. Additional permissions should be obtained from the applicable author or publisher of the image. Full text @ Gut Microbes