
Figure 6.
- ID
- ZDB-FIG-241127-28
- Publication
- Roux et al., 2024 - Transcriptional profiling of zebrafish intestines identifies macrophages as host cells for human norovirus infection
- Other Figures
- All Figure Page
- Back to All Figure Page
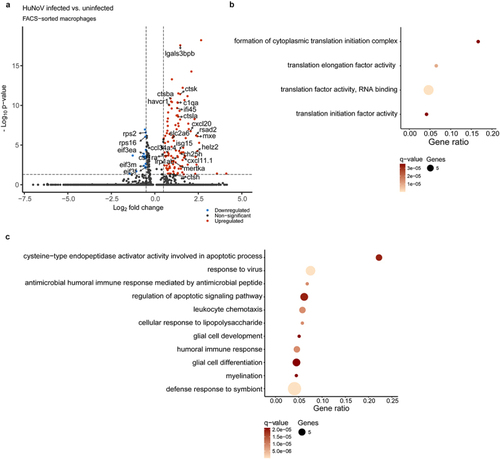
Single-cell analysis reveals inhibition of cytoplasmic translation and enhanced phagocytosis in HuNoV-infected macrophages. (a) A volcano plot shows the DEGs in HuNoV-infected vs. uninfected bystander macrophages within the HuNoV-infected zebrafish host. A vertical dotted line marks a log2(fold change) value of 0.5, while the horizontal dotted line marks a benjamini-Hochberg q-value of 0.05. Dot plot showing the pathways obtained via a ClueGO hypergeometric enrichment pathway analysis of (b) downregulated and (c) upregulated DEGs using the gene ontology - biological process database. HuNoV = human norovirus, DEGs = differentially expressed genes. |