IMAGE

Figure 2.

ID
ZDB-IMAGE-241127-13
Source
Figures for Roux et al., 2024
Image
Figure Caption

Figure 2.

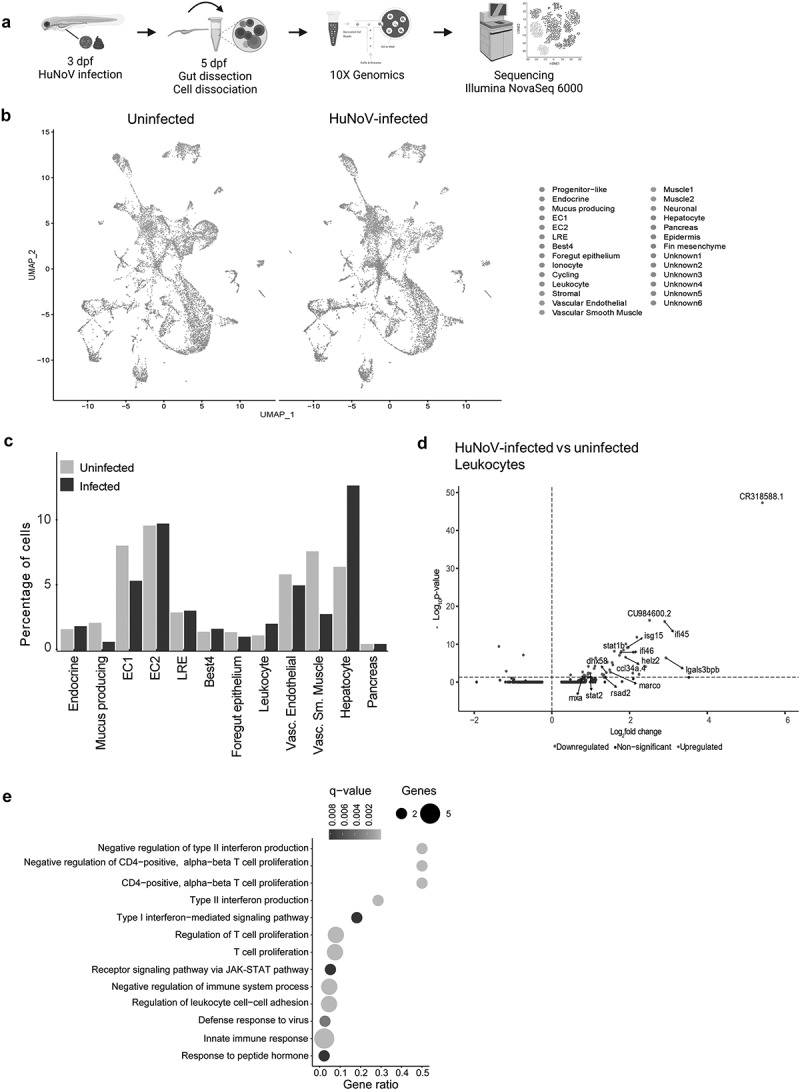
A scRNA-seq analysis on dissected zebrafish larval intestines shows an increase in leukocytes and an important role in the antiviral immune response. (a) Experimental design for transcriptional profiling of single cells in the zebrafish intestine. (b) Aggregated data of all intestinal cells (N = 22,958 cells (11,631 from uninfected and 11,327 from HuNoV-infected zebrafish larvae)) are represented by UMAP clustering and colored according to the unique cell cluster based on their transcriptional profile. (c) Differences in the proportions of cells between the uninfected and HuNoV-infected conditions are further displayed in detail in bar charts. (d) Volcano plots showing DEGs for the comparison of HuNoV-infected versus uninfected zebrafish larval leukocytes within the intestines. A vertical dotted line marks a log2(fold change) value of zero, while the horizontal dotted line marks a BenjaminiHochberg q-value of 0.05. Genes involved in relevant pathways involved in the innate immune response of antiviral signaling are displayed. (e) Dot plot showing the results of a ClueGO hypergeometric enrichment pathway analysis of upregulated DEGs using the gene ontology - biological process database. HuNoV = human norovirus, DEGs = differentially expressed genes.

Acknowledgments
This image is the copyrighted work of the attributed author or publisher, and ZFIN has permission only to display this image to its users. Additional permissions should be obtained from the applicable author or publisher of the image. Full text @ Gut Microbes