
|
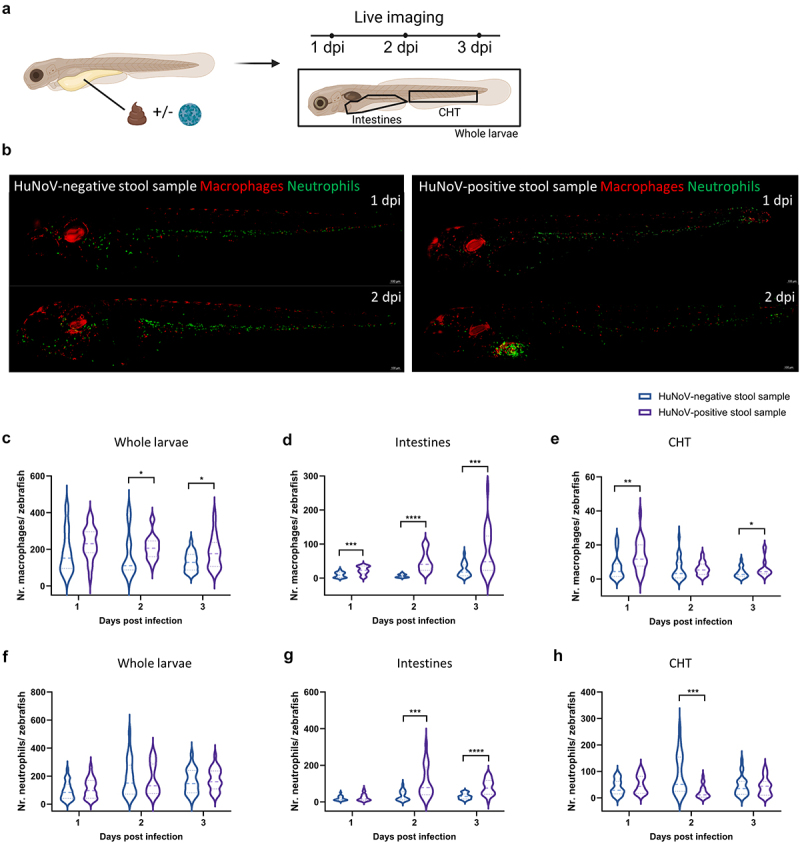
Figure 1.
Upon HuNoV infection macrophages expand and are attracted to the intestines. (a) A schematic overview illustrating the experimental setup where zebrafish larvae were injected with either a HuNoV-negative or -positive stool sample, followed by live imaging at 1, 2, and 3 dpi. (b) Representative fluorescent images (10X magnification) of zebrafish larvae from the transgenic line Tg(fms:Gal4/UAS:nfsB:mCherry/mpx:GFP) injected with HuNoV-negative or -positive stool samples. The images show the recruitment of macrophages (red) and neutrophils (green) to the intestinal region where HuNoV infection occurs. Images were deconvoluted using leica LAS X imaging software. (c-e) quantification of macrophages in (c) whole larvae, (d) intestines, and (e) the caudal hematopoietic tissue (CHT) using ImageJ, in zebrafish injected with either a HuNoV-negative or positive stool sample. (f-h) quantification of neutrophils in (f) whole larvae, (g) intestines, and (h) the CHT using ImageJ, in zebrafish injected with either a HuNoVnegative or -positive stool sample. For panels (c-h), data from 22-24 larvae per condition are shown as violin plots with medians, with outliers removed (ROUT, Q = 1%). Statistical analysis was performed using the Mann-Whitney test, with significant differences marked by asterisks: *