
- Title
-
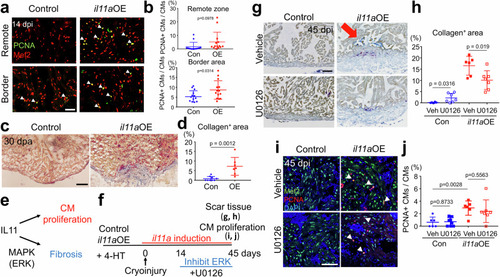
Harnessing the regenerative potential of interleukin11 to enhance heart repair
- Authors
- Shin, K., Rodriguez-Parks, A., Kim, C., Silaban, I.M., Xia, Y., Sun, J., Dong, C., Keles, S., Wang, J., Cao, J., Kang, J.
- Source
- Full text @ Nat. Commun.
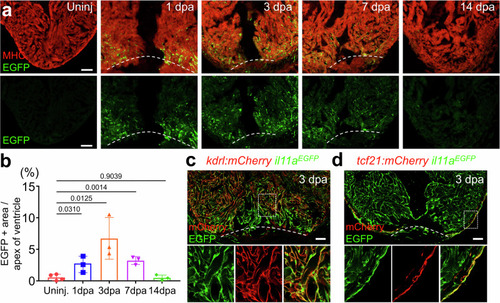
Spatiotemporal |
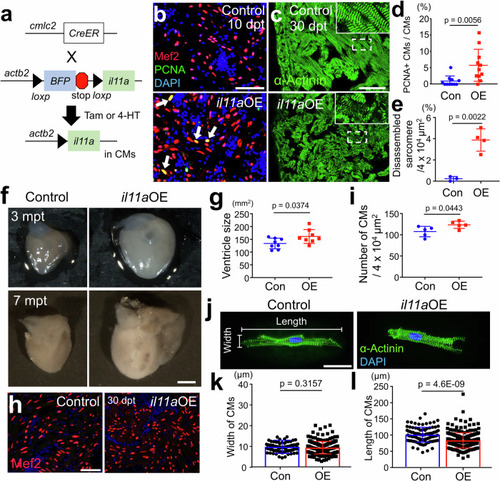
Myocardial |
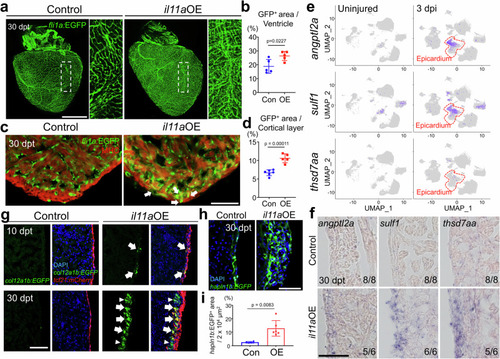
|
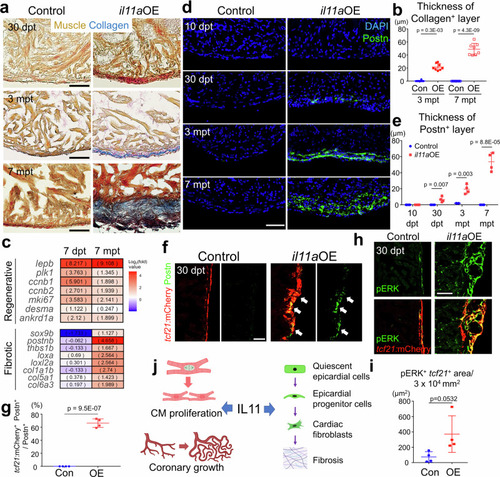
Fibrotic roles of |
Combinatorial treatment enables to harness the regenerative potential of |