FIGURE SUMMARY
Title

Differential Localization and Functional Roles of mGluR6 Paralogs in Zebrafish Retina

Authors
Haug, M., Haddad-Velioglu, S.A., Berger, M., Enz, A., Zang, J., Neuhauss, S.C.F.
Source
Full text @ Invest. Ophthalmol. Vis. Sci.

Localization of mglur6-pathway genes labeled by fluorescence in situ hybridization. (AF) Z-stacks of two to three images of adult zebrafish retinal slices taken with a confocal microscope. (AF′) Genes in A–F are coexpressed in the same cell body as shown by differential interference contrast (DIC) images as background. (A, A′) The arrowheads point to bipolar cell soma where mglur6b and mglur6a colocalize. While mglur6a labeling is restricted to the medial inner nuclear layer (INL), the mglur6b riboprobe additionally labels cell bodies in the proximal INL (arrows). (B, B′) The α-subunit of the G-protein (gnaob) is located in the same ON-bipolar cells as mglur6a (arrowheads). (C, C′) mglur6a colocalizes with trpm1a in ON-bipolar cells (arrowheads), but for some cell bodies, it is unclear whether exactly the same soma or two different cell bodies next to each other are labeled (arrow). (D, D′) The mglur6b riboprobe is expressed in the same cells where trpm1a is located (arrowheads). (E, E′) The cation channel trpm1a colocalizes with nyx in green in the medial INL (arrowheads). (F, F′) Both trpm1 channel genes are expressed in the INL. While trpm1a clearly labels ON-bipolar cell soma (arrowheads), trpm1b is only marginally expressed in the medial INL but rather labels structures in the proximal INL. All images reveal the whole INL, as depicted in D. Scale bars: 10 µm. Scale bars differ in each figure, so they are individually labeled.

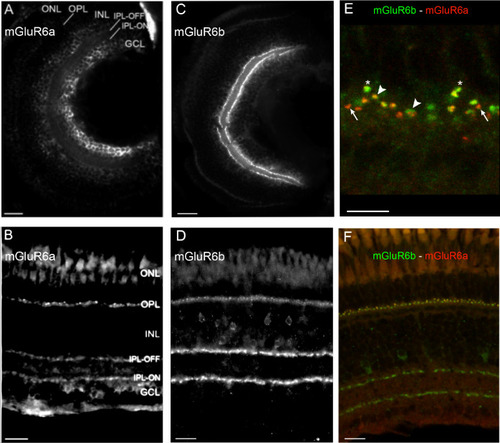
Retinal expression of mGluR6 paralogs in larval and adult zebrafish. (AD) Immunohistochemical labeling of mGluR6a on larval (A) and adult (B) and mGluR6b on larval (C) and adult (D) retinal cross sections. (E, F) Costaining of mGluR6a (red) and mGluR6b (green) on adult retinal cross sections. In (E), a zoom-in on the OPL shows where mGluR6b (asterisk) and mGluR6a (long arrow) do not overlap and where mGluR6a and mGluR6b expression overlaps (large arrowhead) (see Supplementary Table S2). GCL, ganglion cell layer; INL, inner nuclear layer; IPL‐OFF, off‐layer of the inner plexiform layer; IPL‐ON, on‐layer of the inner plexiform layer; ONL, outer nuclear layer; OPL, outer plexiform layer. Scale bars: 20 µm, except E, where the scale bar = 5 µm.

mGluR6a paralog expression in photoreceptor subtype synapses. (AD′) Z-stacks of adult retinal slices taken with a confocal microscope. The different transgenic lines express GFP under different cone opsin promotors. Anti-PKCα antibody staining labels ON-bipolar cells in blue; in panels AE′, pink labels mGluR6a puncta; and in panels FJ′, pink labels mGluR6b puncta. (A, A) LWS1-2 transgenic fish are expressing GFP in their red cones. (B, B′) RH2-2 transgenic fish expressing GFP in green cones. (C, C′) SWS2 transgenic fish expressing GFP in blue cones (*mGluR6a negative; **mGluR6a positive). (D, D′) SWS1 transgenic fish expressing GFP in their UV cones. (E, E′) RH1-3 transgenic fish line expressing GFP in rod photoreceptors. (F, F′) LWS1-2 transgenic fish expressing GFP in their red cones (*mGluR6b negative; **mGluR6b positive). (G, G′) RH2-2 transgenic fish expressing GFP in green cones. (H, H′) SWS2 transgenic fish expressing GFP in their blue cones. (I, I′) SWS1 transgenic fish expressing GFP in their UV cones. (J, J′) RH1-3 transgenic fish line expressing GFP in their rod photoreceptors. The closeups in every image show representative cone-to-ON-bipolar cell synapses for the corresponding staining. Scale bar: 10 µm; scale bar of the closeup: 2 µm.

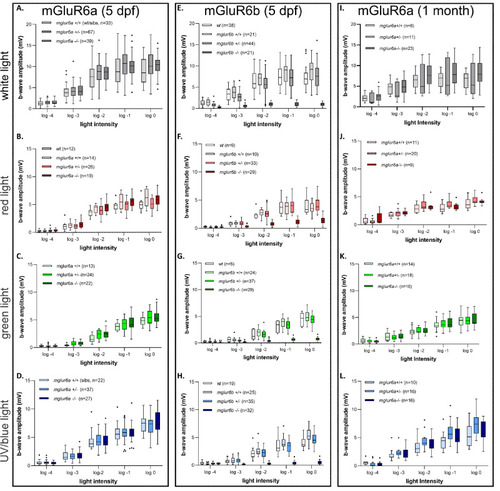
Spectral ERG measurements of the peak b-wave response in mglur6a and mglur6b mutant fish. The peak b-wave amplitude was quantified at five different light intensity stimuli, at different spectral wavelengths. (AD) The peak b-wave measured in 5 dpf mglur6a mutant fish. There is no significant difference between wild-type and KO fish in any of the various spectra (see Materials and Methods for wavelengths of various stimuli). (A) White light stimulus. (B) Red light stimulus. (C) Green light stimulus. (D) UV/blue light stimulus. (EH) The peak b-wave measured in 5 dpf mglur6b mutant fish. mglur6b/ fish show a significantly decreased b-wave amplitude in response to all stimuli. (E) White light stimulus. (F) Red light stimulus. (G) Green light stimulus. (H) UV/blue light stimulus. (IL) The peak b-wave measured in adult mGluR6a mutant fish. There is no significant difference between wild-type and KO fish in any of the various spectra. (I) White light stimulus. (J) Red light stimulus. (K) Green light stimulus. (L) UV/blue light stimulus. (For all statistical data and significance, please see Supplementary Table S3.)

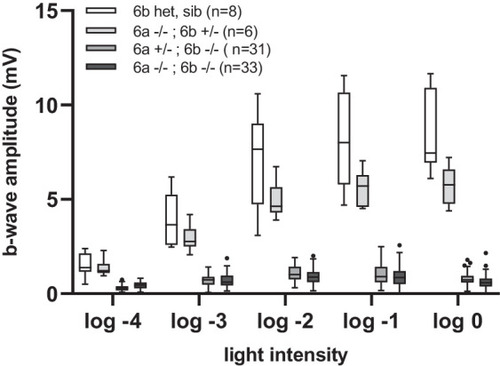
White light ERG measurements of the peak b-wave response in mglur6 paralog double-mutant fish. The peak b-wave amplitude was quantified at 5 different light intensity stimuli, using a white light stimulus, in double-mutant mglur6a/mglur6b/ fish in comparison to heterozygous crosses and controls. (For all statistical data and significance, see Supplementary Excel Sheet 1.)

Acknowledgments
This image is the copyrighted work of the attributed author or publisher, and ZFIN has permission only to display this image to its users. Additional permissions should be obtained from the applicable author or publisher of the image. Full text @ Invest. Ophthalmol. Vis. Sci.