FIGURE

Figure 4.

ID
ZDB-FIG-241106-22
Publication
Haug et al., 2024 - Differential Localization and Functional Roles of mGluR6 Paralogs in Zebrafish Retina
Other Figures
All Figure Page
Back to All Figure Page
Figure 4.

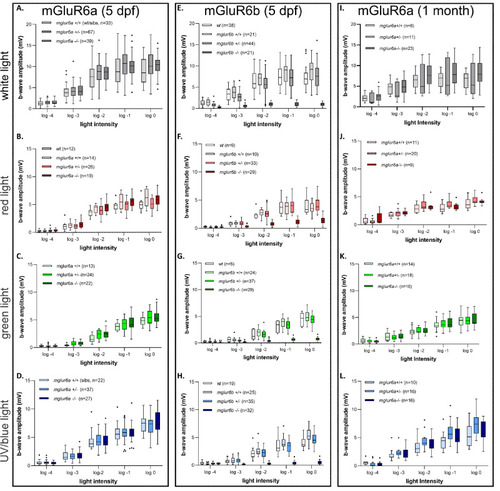
Spectral ERG measurements of the peak b-wave response in mglur6a and mglur6b mutant fish. The peak b-wave amplitude was quantified at five different light intensity stimuli, at different spectral wavelengths. (AD) The peak b-wave measured in 5 dpf mglur6a mutant fish. There is no significant difference between wild-type and KO fish in any of the various spectra (see Materials and Methods for wavelengths of various stimuli). (A) White light stimulus. (B) Red light stimulus. (C) Green light stimulus. (D) UV/blue light stimulus. (EH) The peak b-wave measured in 5 dpf mglur6b mutant fish. mglur6b/ fish show a significantly decreased b-wave amplitude in response to all stimuli. (E) White light stimulus. (F) Red light stimulus. (G) Green light stimulus. (H) UV/blue light stimulus. (IL) The peak b-wave measured in adult mGluR6a mutant fish. There is no significant difference between wild-type and KO fish in any of the various spectra. (I) White light stimulus. (J) Red light stimulus. (K) Green light stimulus. (L) UV/blue light stimulus. (For all statistical data and significance, please see Supplementary Table S3.)

Expression Data

Expression Detail
Antibody Labeling
Phenotype Data

Phenotype Detail
Acknowledgments
This image is the copyrighted work of the attributed author or publisher, and ZFIN has permission only to display this image to its users. Additional permissions should be obtained from the applicable author or publisher of the image. Full text @ Invest. Ophthalmol. Vis. Sci.