
- Title
-
Defects in exosome biogenesis are associated with sensorimotor defects in zebrafish vps4a mutants
- Authors
- Shipman, A., Gao, Y., Liu, D., Sun, S., Zang, J., Sun, P., Syed, Z., Bhagavathi, A., Smith, E., Erickson, T., Hill, M., Neuhauss, S., Sui, S.F., Nicolson, T.
- Source
- Full text @ J. Neurosci.
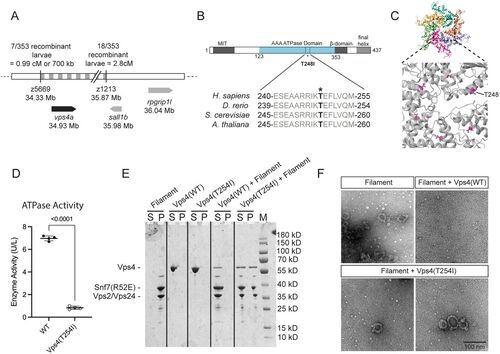
The T248I mutation in vps4a reduces ATPase activity and ESCRT-III filament disassembly. A, vps4a is located on Chromosome 25 in a location corresponding to where classical mapping methods have identified the location of the gene responsible for the raumschiff phenotypes. B, Bar diagram of Vps4a protein showing the location of the T248I mutation. C, Atomic model structure of the Vps4E233Q hexamer, with T248 marked in magenta (Image adapted from the RCSB PDB ID:5XMI, using Mol*). D, Mutant Vps4 (T254I) yeast protein has decreased ATP activity compared with wild-type Vps4 protein. Unpaired t test; p < 0.0001; nWT = 4; nvps4(T254I) = 4; t = 47.92; df = 6. E, Sedimentation analysis of Vps4 and Vps4(T254I)-mediated disassembly of ESCRT-III filaments. Pellet (P) and supernatant (S) fractions were analyzed by SDS–PAGE. Marker (M). F, Negative staining EM micrograph of sedimentation analysis of ESCRT-III filament disassembly. |
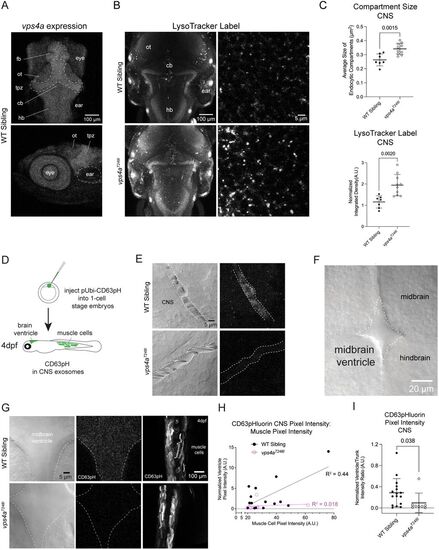
vps4aT248I mutants have enlarged endosomal compartments and release fewer exosomes in the CNS. A, Confocal Z-projections of a 5 dpf wild-type zebrafish larva labeled with HCR RNA-FISH probes for vps4a. fb, forebrain; ot, optic tectum; tpz, tectal proliferation zone, cb, cerebellum; hb, hindbrain. B, LysoTracker staining of 5 dpf wild-type siblings and vps4aT248I mutants show an increased staining in the mutant. C, Acidic membrane compartment size in the hindbrain of vps4aT248I mutants (N = 10) is significantly larger than those in wild-type siblings (N = 7); unpaired t test; p = 0.0015; t = 3.873; df = 15. LysoTracker vital dye taken up by vps4aT248I mutants (N = 10), measured as normalized pixel integrated density, is significantly higher compared with wild-type siblings (N = 7); unpaired t test; p = 0.0020; t = 3.744; df = 15. D, Schematic of injecting one-cell stage nacre-background embryos with pUbi:CD63-pHluorin. Healthy larvae were sorted on 1 dpf, and larvae expressing CD63-pHluorin in muscle cells was sorted on 3 dpf, for imaging on 4 dpf. E, Decreased CD63-pHluorin expression in 3 dpf vps4aT248I mutant CNS blood vessels. F, Dorsal view of 4 dpf zebrafish larva showing the midbrain ventricle. G, Decreased CD63-pHluorin expression in vps4aT248I mutant brain ventricles, but trunk muscles express comparable levels to wild-type siblings. H, Pixel intensity of muscles cells is correlated with normalized pixel intensity of CD63-pHluorin signal in the midbrain ventricle in wild-type siblings (N = 16). I, Quantification of CD63-pHluorin fluorescence in wild-type siblings (N = 16) and vps4aT248I mutants (N = 8); Mann–Whitney test; p = 0.0382 (exact). PHENOTYPE:
|
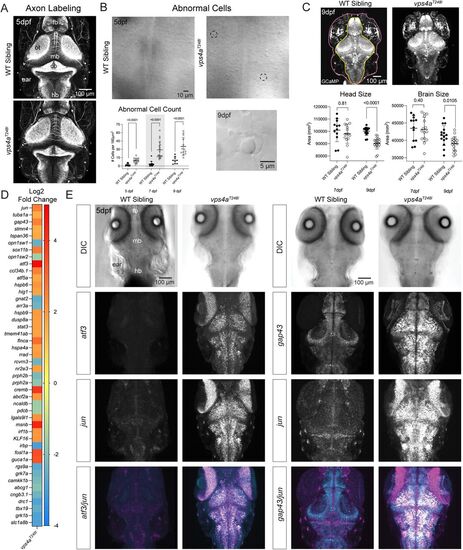
vps4aT248I mutants upregulate stress response and regeneration genes in the CNS. A, Axons labeled with acetylated tubulin antibody staining of vps4aT248I mutants show no gross morphological defects. Fb, forebrain; ot, optic tectum; mb, midbrain; cb, cerebellum; hb, hindbrain. B, vps4aT248I mutants have an increase of morphologically abnormal, pyknotic cells in the CNS. Two examples are highlighted with black dashed circles. The number of abnormal cells in the vps4aT248I mutants was quantified and found to be significantly higher than in wild-type siblings at both 5 and 7 dpf; Mann–Whitney test; 5 dpf, p < 0.0001 (exact), nWT = 12, nvps4a(T248I) = 14; 7 dpf, p < 0.0001 (exact), nWT = 15, nvps4a(T248I) = 18; 9 dpf, p < 0.0001 (exact), nWT = 9, nvps4a(T248I) = 13. C, vps4aT248I mutants have a smaller head (unpaired t test, 7 dpf, p = 0.3979, t = 0.8602, df = 25, nWT = 12, nvps4a(T248I) = 15; 9 dpf, p < 0.0001, t = 6.933, df = 31, nWT = 15, nvps4a(T248I) = 18) and brain (unpaired t test, 7 dpf, p = 0.8127, t = 0.2395, df = 25, nWT = 12, nvps4a(T248I) = 15; 9 dpf, p = 0.0105, t = 2.722, df = 31, nWT = 15, nvps4a(T248I) = 18) at 9 dpf. The ROI for the head measurement is outlined in pink and the ROI for the brain measurement is outlined in yellow. D, Heat map showing Log2 fold change gene expression in vps4aT248I mutants relative to control WT siblings. E, Maximum intensity projections of atf3 and jun and gap43 and jun mRNA expression in the hindbrain of 5 dpf wild-type sibling and vps4aT248I mutants. EXPRESSION / LABELING:
PHENOTYPE:
|

Impaired vision in vps4aT248I mutants. A, 5 dpf vps4aT248I mutants (N = 10) have a severely reduced optomotor response compared with wild-type siblings (N = 12); Mann–Whitney test; p < 0.0001 (exact). B, Decreased b-wave amplitude in ERGs of 5–6 dpf vps4aT248I mutants (N = 34) in comparison with wild-type siblings (N = 23) occurs at brighter light intensities (log −4 to log 0); Kruskal–Wallis test (log 0, p < 0.0001; log −1, p < 0.0001; log −2, p < 0.0001; log −3, p = 0.0014; log −4, p = 0.1989). C, HCR RNA-FISH of gap43, jun, and opn1sw1 in the eye of vps4aT248I mutants compared with wild-type siblings. Pr, photoreceptors; Rg, retinal ganglion cells, lens. |

vps4aT248I mutants have selective defects in vestibular circuitry. A, 5 dpf vps4aT248I mutants (N = 16) do not have a significantly different VIEM compared with wild-type siblings (N = 18); Mann–Whitney test; p = 0.4632 (exact). B, 5 dpf vps4aT248I mutants (N = 10) have a reduced VSR compared with wild-type siblings (N = 7); Mann–Whitney test; p = 0.0012 (exact). C, Simplified schematic showing the flow of information evoked by head rotation from the inner ear to hindbrain nuclei, vestibuloocular neurons, and motor neurons. UHC, utricular hair cells; CN VIII, VIIIth nerve; SVN, superior vestibular nucleus; VS, vestibulospinal cells; TAN, tangential neurons; M, Mauthner cell; CN IV, trochlear nucleus; CN III, oculomotor nucleus; OM, oculomotor muscles. D, 5 dpf larva showing basal GCaMP7a expression and backfill injected rhodamine dextran marking the Mauthner cell (M). White dotted lines indicate the presumptive TAN, SVN, and VS regions, and a solid yellow line designates a dextran filled VS neuron. Other landmarks include fibers running parallel and perpendicular fibers to the inner ear cavity (yellow arrows), a lateral cleft between mid- and hindbrain lobes (white arrowhead) and portion of the occipital arch cartilage (yellow asterisk). D’, Pre- and poststimulus GCaMP7a levels in vestibular region in a representative wild-type sibling and vps4aT248I mutant. The TAN, SVN, and VS ROIs are outlined by dotted lines. E, Average trace of normalized fluorescence (F) for the TAN, SVN, and VS of wild-type siblings and vps4aT248I mutants during auditory stimulation at 600 Hz. F, Percentage change in fluorescence of the presumptive TAN, SVN, and VS of wild-type siblings and vps4aT248I mutants during auditory stimulation at 600 Hz. The VS in vps4aT248I mutants (N = 11) have a reduced change in fluorescence compared with wild-type siblings (N = 15); unpaired t test; p = 0.0337; t = 2.252; df = 24. Single VS neurons in vps4aT248I mutants (N = 9 cells from 4 larva) also have a reduced change in fluorescence compared with wild-type siblings (N = 26 cells from 14 larva); unpaired t test; p = <0.0001; t = 6.195; df = 33. There is no significant difference between mutants and wild-type siblings in the TAN (unpaired t test; p = 0.1405; t = 1.524; df = 24) or SVN (unpaired t test; p = 0.6224; t = 0.4988; df = 24). PHENOTYPE:
|
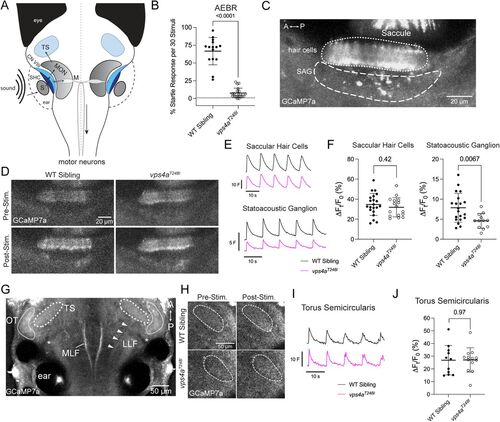
Activation of the ascending auditory pathway in vps4aT248I mutants. A, Simplified schematic showing the flow of information from an auditory stimulus to motor neurons or to the torus semicircularis. S, saccular otolith; SHC, saccular hair cells; CN VIII, VIIIth nerve; MON, medial octavolateralis nucleus; M, Mauthner cell; TS, torus semicircularis. B, 5 dpf vps4aT248I mutants (N = 20) have a greatly reduced AEBR compared with wild-type siblings (N = 15); Mann–Whitney test; p < 0.0001 (exact). C, Basal levels of GCaMP7a expression in the inner ear of 5 dpf larvae, focusing on the saccular hair cells (dotted line) and statoacoustic ganglion (SAG; dashed line). D, Pre- and poststimulus GCaMP7a levels in saccular hair cells and SAG in a representative wild-type sibling and vps4aT248I mutant larvae. E, Average traces of normalized fluorescence (F) for the saccular hair cells and raw fluorescence (F) for the SAG of wild-type siblings and vps4aT248I mutants during auditory stimulation at 600 Hz. F, Percentage change in fluorescence of the saccular hair cells and SAG of wild-type siblings and vps4aT248I mutants during auditory stimulation at 600 Hz. There is no significant difference between mutants (N = 13) and wild-type siblings (N = 20) in the saccular hair cells (unpaired t test; p = 0.4162; t = 0.8228; df = 35). However, there is a partial decrease in percentage change fluorescence in the SAG (unpaired t test; p = 0.0067; t = 2.911; df = 30). G, Representative image of basal levels of GCaMP7a expression in 5 dpf zebrafish focusing on the TS (torus semicircularis, thick dashed line) and anatomical landmarks: MLF, medial longitudinal fascicles; LLF, lateral longitudinal fascicles (white arrowheads); OT, ventral edge of optic tectum (thin dashed line); S, saccule. Midbrain clefts are marked with an asterisk. H, Pre- and poststimulus GCaMP7a levels in the TS in representative wild-type sibling and vps4aT248I mutant larvae. I, Average trace of normalized fluorescence (F) for the TS of wild-type siblings and vps4aT248I mutants during auditory stimulation at 600 Hz. J, There is no significant difference in percentage change fluorescence between vps4aT248I mutants (N = 13) and wild-type siblings (N = 11) in the TS; unpaired t test; p = 0.9672; t = 0.04157; df = 22. PHENOTYPE:
|
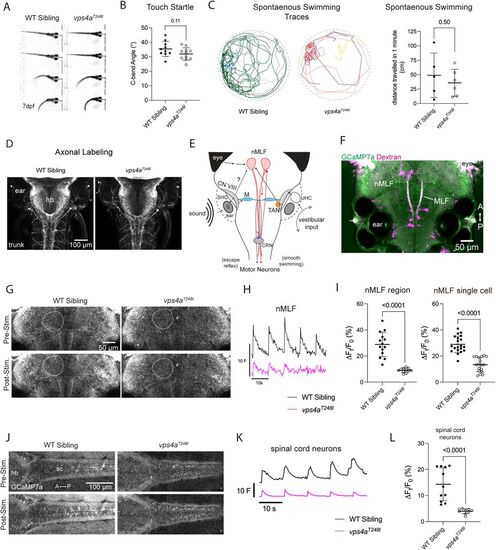
vps4aT248I mutants display defects in sensorimotor transformation. A, 7 dpf vps4aT248I mutant larvae have an intact startle reflex in response to aversive touch stimuli. B, 7 dpf vps4aT248I mutants (N = 11) do not have a significantly different C-bend angle compared with wild-type siblings (N = 10); unpaired t test; p = 0.1079; t = 1.687; df = 19. C, Traces of spontaneous swimming from 6 dpf wild-type siblings and mutants over the course of 1 min. vps4aT248I larvae (N = 5) swim shorter distances compared with wild-type siblings (N = 6); unpaired t test; p = 0.5063; t = 0.6921; df = 9) D, Acetylated tubulin antibody staining of vps4aT248I mutants shows no gross morphological defects in hindbrain/spinal cord or somatosensory axons. E, Simplified schematic showing the flow of information from a tone stimulus from the inner ear to motor neurons via Mauthner cell and nMLF pathways. S, saccular otolith; SHC, saccular hair cells; CN VIII, VIIIth nerve; M, Mauthner cell; CRN, cranial relay neurons; nMLF, nucleus of the medial longitudinal fasciculus; TAN, tangential neurons; UHC, utricular hair cells. F, 5 dpf larva showing basal GCaMP7a expression and backfill injected rhodamine dextran marking single cells within the nMLF. The nMLF region is outlined with a dotted line. G, Pre- and poststimulus GCaMP7a levels in the nMLF in a representative wild-type sibling and vps4aT248I mutant. H, Average trace of normalized fluorescence (F) for the nMLF of wild-type siblings and vps4aT248I mutants during tone stimulation at 600 Hz. I, vps4aT248I mutants (N = 11) have a significantly reduced percentage change fluorescence in the nMLF compared with wild-type siblings (N = 14); unpaired t test; p < 0.0001; t = 6.937; df = 23. Single backfilled neurons of the nMLF in vps4aT248I mutants (N = 18 cells from 6 larvae) also have a reduced change in percentage fluorescence compared with wild-type siblings (N = 20 cells from 9 larvae); unpaired t test; p < 0.0001; t = 8.018; df = 36. J, Pre- and poststimulus GCaMP7a levels in the spinal cord motor neurons of representative wild-type sibling and vps4aT248I mutant. K, Average trace of normalized fluorescence (F) for the spinal cord motor neurons of wild-type siblings and vps4aT248I mutants during tone stimulation at 450 Hz. L, vps4aT248I mutants (N = 9) have a significantly reduced percentage change fluorescence in spinal cord neurons compared with wild-type siblings (N = 11), Mann–Whitney test; p < 0.0001 (exact). |