
Fig. 3
- ID
- ZDB-IMAGE-250115-3
- Genes
- Publication
- Shipman et al., 2024 - Defects in exosome biogenesis are associated with sensorimotor defects in zebrafish vps4a mutants
- All Figures
- Figures for Shipman et al., 2024
|
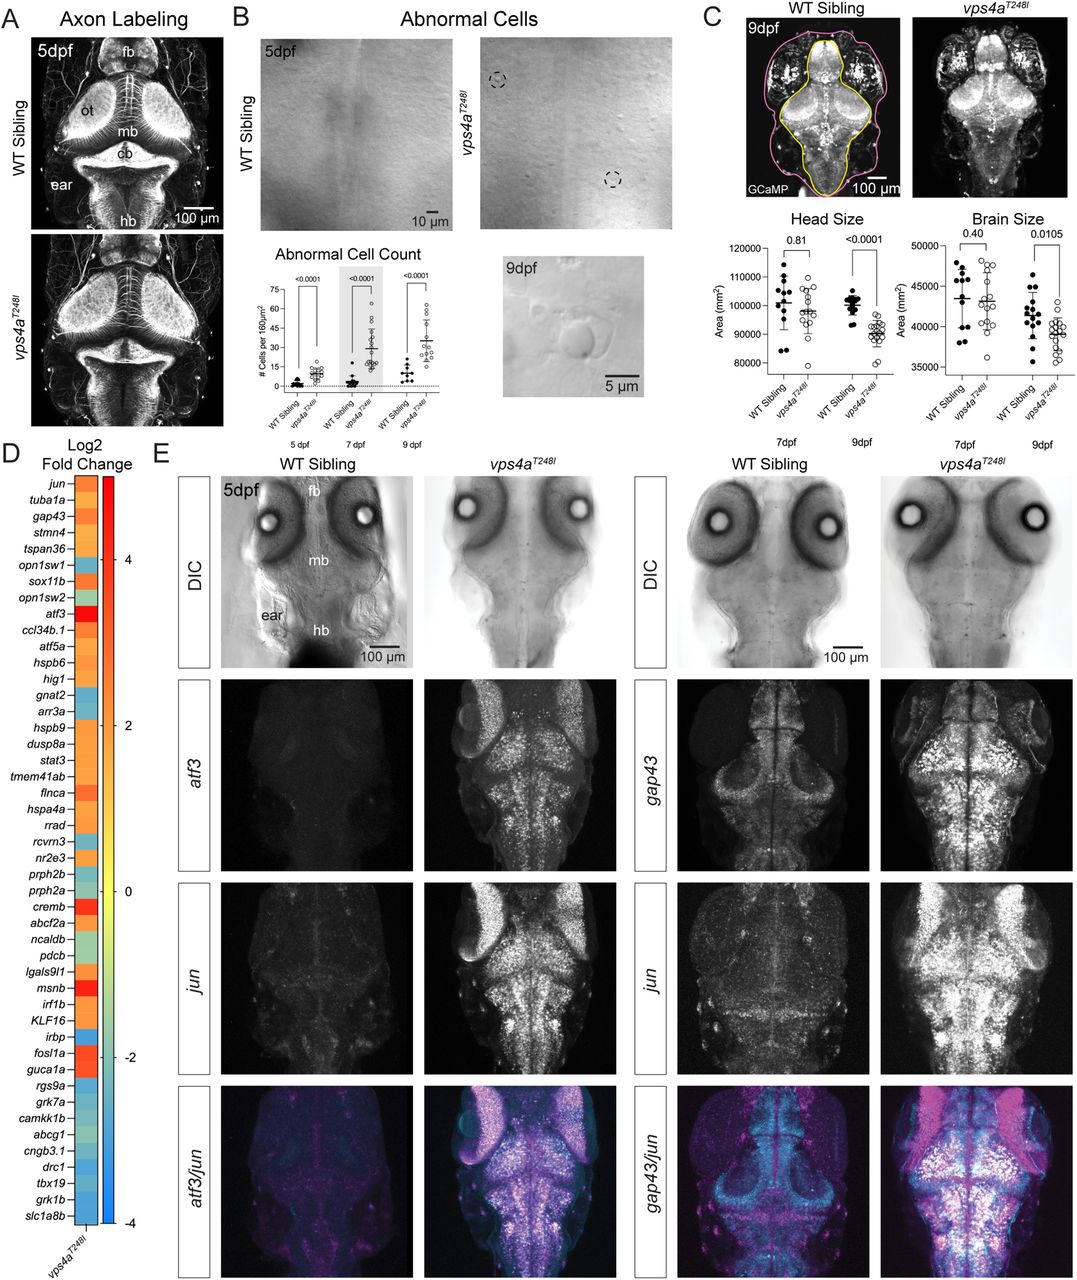
Fig. 3 vps4aT248I mutants upregulate stress response and regeneration genes in the CNS. A, Axons labeled with acetylated tubulin antibody staining of vps4aT248I mutants show no gross morphological defects. Fb, forebrain; ot, optic tectum; mb, midbrain; cb, cerebellum; hb, hindbrain. B, vps4aT248I mutants have an increase of morphologically abnormal, pyknotic cells in the CNS. Two examples are highlighted with black dashed circles. The number of abnormal cells in the vps4aT248I mutants was quantified and found to be significantly higher than in wild-type siblings at both 5 and 7 dpf; Mann–Whitney test; 5 dpf, p < 0.0001 (exact), nWT = 12, nvps4a(T248I) = 14; 7 dpf, p < 0.0001 (exact), nWT = 15, nvps4a(T248I) = 18; 9 dpf, p < 0.0001 (exact), nWT = 9, nvps4a(T248I) = 13. C, vps4aT248I mutants have a smaller head (unpaired t test, 7 dpf, p = 0.3979, t = 0.8602, df = 25, nWT = 12, nvps4a(T248I) = 15; 9 dpf, p < 0.0001, t = 6.933, df = 31, nWT = 15, nvps4a(T248I) = 18) and brain (unpaired t test, 7 dpf, p = 0.8127, t = 0.2395, df = 25, nWT = 12, nvps4a(T248I) = 15; 9 dpf, p = 0.0105, t = 2.722, df = 31, nWT = 15, nvps4a(T248I) = 18) at 9 dpf. The ROI for the head measurement is outlined in pink and the ROI for the brain measurement is outlined in yellow. D, Heat map showing Log2 fold change gene expression in vps4aT248I mutants relative to control WT siblings. E, Maximum intensity projections of atf3 and jun and gap43 and jun mRNA expression in the hindbrain of 5 dpf wild-type sibling and vps4aT248I mutants.