
Fig. 6
- ID
- ZDB-IMAGE-250115-6
- Publication
- Shipman et al., 2024 - Defects in exosome biogenesis are associated with sensorimotor defects in zebrafish vps4a mutants
- All Figures
- Figures for Shipman et al., 2024
|
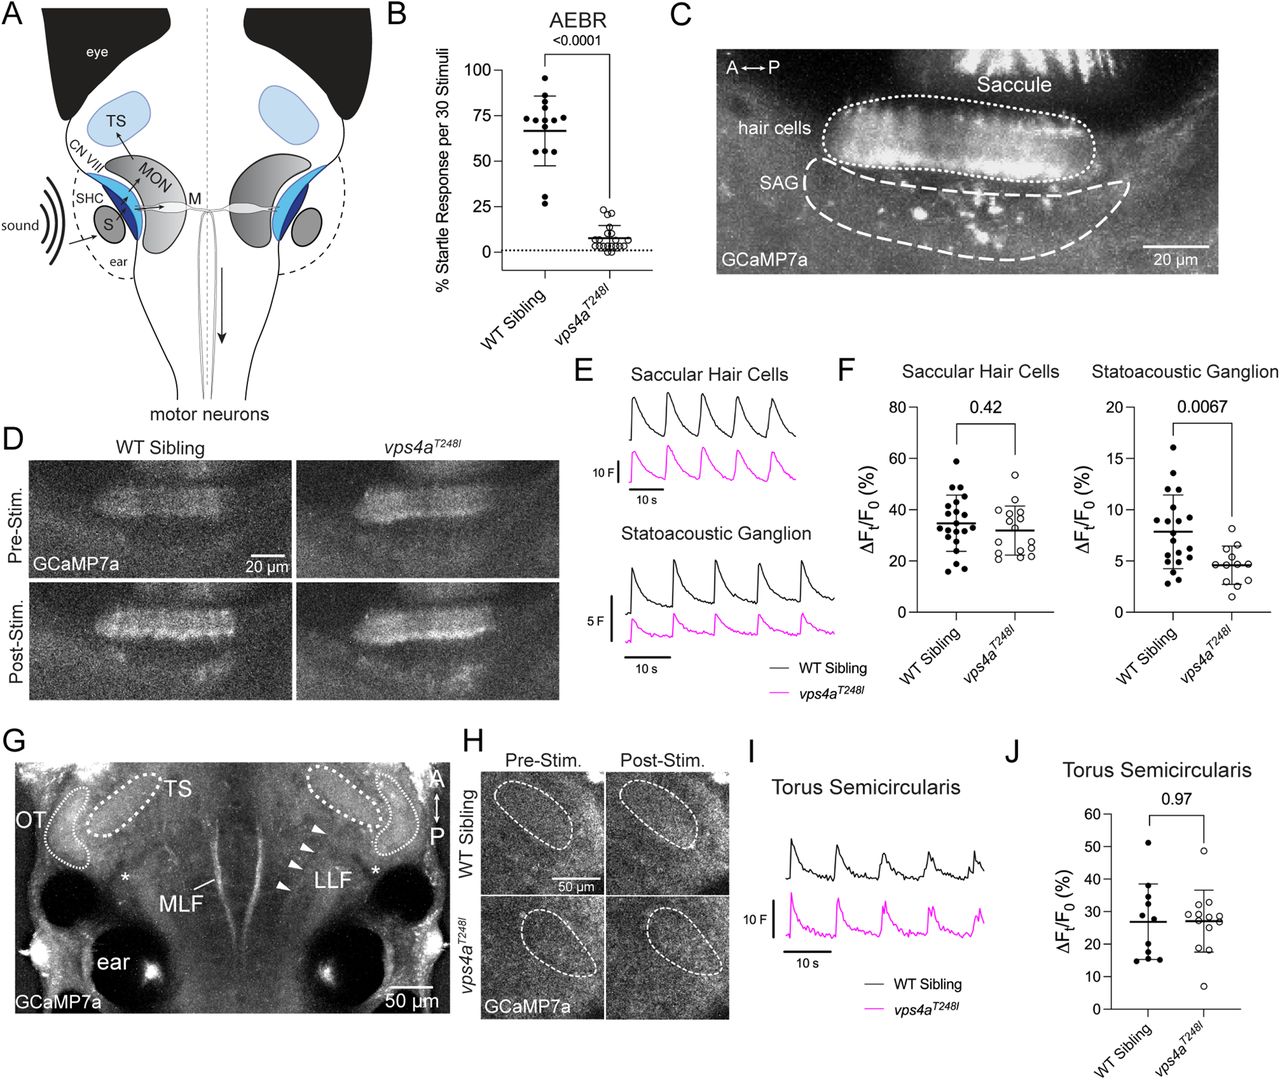
Fig. 6 Activation of the ascending auditory pathway in vps4aT248I mutants. A, Simplified schematic showing the flow of information from an auditory stimulus to motor neurons or to the torus semicircularis. S, saccular otolith; SHC, saccular hair cells; CN VIII, VIIIth nerve; MON, medial octavolateralis nucleus; M, Mauthner cell; TS, torus semicircularis. B, 5 dpf vps4aT248I mutants (N = 20) have a greatly reduced AEBR compared with wild-type siblings (N = 15); Mann–Whitney test; p < 0.0001 (exact). C, Basal levels of GCaMP7a expression in the inner ear of 5 dpf larvae, focusing on the saccular hair cells (dotted line) and statoacoustic ganglion (SAG; dashed line). D, Pre- and poststimulus GCaMP7a levels in saccular hair cells and SAG in a representative wild-type sibling and vps4aT248I mutant larvae. E, Average traces of normalized fluorescence (F) for the saccular hair cells and raw fluorescence (F) for the SAG of wild-type siblings and vps4aT248I mutants during auditory stimulation at 600 Hz. F, Percentage change in fluorescence of the saccular hair cells and SAG of wild-type siblings and vps4aT248I mutants during auditory stimulation at 600 Hz. There is no significant difference between mutants (N = 13) and wild-type siblings (N = 20) in the saccular hair cells (unpaired t test; p = 0.4162; t = 0.8228; df = 35). However, there is a partial decrease in percentage change fluorescence in the SAG (unpaired t test; p = 0.0067; t = 2.911; df = 30). G, Representative image of basal levels of GCaMP7a expression in 5 dpf zebrafish focusing on the TS (torus semicircularis, thick dashed line) and anatomical landmarks: MLF, medial longitudinal fascicles; LLF, lateral longitudinal fascicles (white arrowheads); OT, ventral edge of optic tectum (thin dashed line); S, saccule. Midbrain clefts are marked with an asterisk. H, Pre- and poststimulus GCaMP7a levels in the TS in representative wild-type sibling and vps4aT248I mutant larvae. I, Average trace of normalized fluorescence (F) for the TS of wild-type siblings and vps4aT248I mutants during auditory stimulation at 600 Hz. J, There is no significant difference in percentage change fluorescence between vps4aT248I mutants (N = 13) and wild-type siblings (N = 11) in the TS; unpaired t test; p = 0.9672; t = 0.04157; df = 22.