FIGURE SUMMARY
Title

Quantum Dots-caused Retinal Degeneration in Zebrafish Regulated by Ferroptosis and Mitophagy in Retinal Pigment Epithelial Cells through Inhibiting Spliceosome

Authors
Zheng, N., Liao, T., Zhang, C., Zhang, Z., Yan, S., Xi, X., Ruan, F., Yang, C., Zhao, Q., Deng, W., Huang, J., Huang, Z.T., Chen, Z.F., Wang, X., Qu, Q., Zuo, Z., He, C.
Source
Full text @ Adv Sci (Weinh)

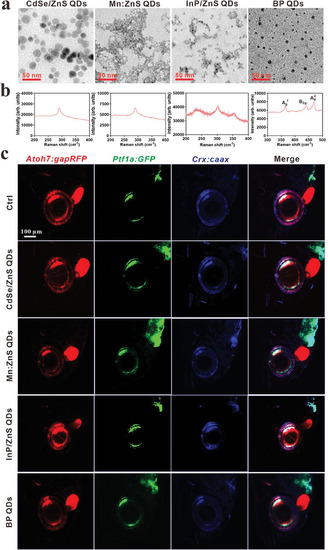
Characterizations of QDs and screening their impacts on the eye development of zebrafish. a) Representative images of QDs by TEM, scale bar, 50 nm. b) The Raman intensity of QDs. c) The lateral views of the effect of QDs (1 mg L−1) on retinal development in Tg (Atoh7:gapRFP::Ptf1a:GFP::Crx:CFPcaax) zebrafish at 168 hpf. The retinal ganglion cell layer (GCL) is labeled by red fluorescence protein (RPF), the inner nuclear layer (INL, including AC and HC) is labeled by green fluorescent protein (GFP), and cyan fluorescent protein (CFP), BC is labeled by CFP, and outer nuclear layer (ONL, composed of PR) labeled by RFP and CFP. Scale bar, 100 µm.

InP/ZnS QDs embryonic exposure caused retinal degeneration in zebrafish. a) Schematic illustration of the experimental design. b) Representative images of the distribution of InP/ZnS QDs on zebrafish eye using fluorescence microscopy. Scale bar, 200 µm. c) Determination of indium element content in the retina of zebrafish by ICP‐MS, n = 6, ND: No Detected. d) Representative images of zebrafish from 72 to 168 hpf after exposure. Scale bar, 1 mm. e) Schematic diagram of horizontal (X) and vertical (Y) axes of zebrafish eye. f) The lengths of X and Y axes in the zebrafish eye at 72–168 hpf, n = 20. Representative images of zebrafish retinal histology at 72 hpf g) and 168 hpf h) as assessed by HE staining. Scale bar, 50 µm. i‐j) Representative images of the retinas of Sofa zebrafish at 72 hpf i) and 168 hpf j) using a light‐sheet microscope. The retinal ganglion cell layer (GCL) is labeled by RPF, the inner nuclear layer (INL, composed of AC and HC) is labeled by GFP and CFP, BC is labeled by CFP, and the outer nuclear layer (ONL, composed of PR) labeled by RFP and CFP. k) Scheme of zebrafish eye. l) The representative images of zebrafish eye by optical coherence tomography (OCT) at 21 dpf. The data are presented as mean ± SE. One‐way ANOVA followed by Duncan test was used to assess the statistical significance. Significant change among different groups (p < 0.05) is indicated by the different letters on the bar.

InP/ZnS QDs embryonic exposure induced many types of cell injury and impaired phototransduction in zebrafish retinas using bulk RNA‐seq. After exposure to InP/ZnS QDs, the zebrafish eyes at 72 hpf were collected to perform RNA‐seq, n = 3. a) The PCA result of control, 0.1 and 1 mg L−1 InP/ZnS QDs. b) Venn diagram of the overlapped DEGs in the 0.1 and 1 mg L−1 groups compared to the control with 0.5‐fold cutoff and p < 0.05. c,d) KEGG pathway analysis of the DEGs in 0.1 c) and 1 mg L−1 groups d), respectively. e) The heatmap of DEGs in the ribosome, ferroptosis, oxidative phosphorylation, and phototransduction pathways. Ferro: ferroptosis, OP: oxidative phosphorylation, PT: phototransduction. f) The qPCR was performed to validate the DEGs determined from RNA‐seq, n ≥ 3.

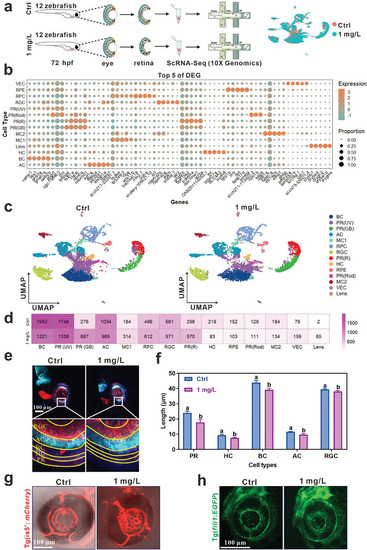
ScRNA‐seq analysis displayed the retinal degenerative damage of zebrafish exposed to InP/ZnS QDs at single cell level. a) Schematic illustration of the scRNA‐seq experimental design. We dissociated the retinas from zebrafish exposed to InP/ZnS QDs from 0.5 to 72 hpf (24 retinas of 12 larvae from each group). b) The top five DEGs of each cluster. c) UMAP plots show the clustering of qualified zebrafish eyes at 72 hpf. Distinct cell types are marked by different colors. d) The cell number of different clusters between control and InP/ZnS QDs‐exposed group. e) The representative images of the retina of Tg (Atoh7:gapRFP::Ptf1a:GFP::Crx:CFPcaax) zebrafish. f) The thicknesses of different layers of zebrafish retina were measured, n = 4. g‐h) The representative images of blood vessels in Tg (is5’:mCherry) g) and Tg (fli1:EGFP) h) zebrafish. Scale bar, 100 µm. The data are presented as mean ± SE. Significant change among different groups (p < 0.05) is indicated by the different letters on the bar.

The number and function alteration of PR cells in zebrafish after exposure to InP/ZnS QDs. a) Pseudotime trajectory analysis of retinal cell development with Monocle. Each dot is a single cell and its color is agreement with its cluster assignment. b–e) The representative images of PR(Rod), PR(UV), PR(GB), and PR(R) of zebrafish at 72 hpf stained by RHO b), OPN1SW1 c), OPN1MW1 d), and OPN1LW2 e), respectively. f–i) The scheme and gain of optokinetic response (OKR) of 168‐hpf zebrafish in Black‐White f), Blue‐White g), Green‐White h), and Red‐White stripes i), n ≥ 5. The data are presented as mean ± SE. Significant change among different groups (p < 0.05) is indicated by the different letters on the bar.

InP/ZnS QDs embryonic exposure promoted the differentiation of PR(UV) to PR(RGB) in zebrafish. a‐e) The bioinformatics analysis was based on the data from scRNA‐seq. a) KEGG pathway analysis of the DEGs in PR(UV) cells. b) The GSEA of PR(UV) cells. c) KEGG pathway analysis of the DEGs in PR(RGB) cells. d) The GSEA of PR(RGB) cells. e) The single‐cell RNA velocity of four types of PR cells in the control and InP/ZnS QDs group, respectively, using by cell velocity. The red cycle indicates the differentiation of PR(UV) to PR(RGB). f) Fluorescence triple staining assay (TSA) was used to track PR(UV), PR(R), and PR(GB), respectively. The white arrowheads display the co‐location of PR(UV) with PR(R) or PR(GB), suggesting the differentiation of PR(UV) to PR(RGB) caused by InP/ZnS QDs exposure. The images were captured by confocal microscopy. Scale bar, 10 µm.

InP/ZnS QDs, endocytosed by RPE cells, caused retinal degenerative damage involved in mitophagy and ferroptosis due to spliceosome inhibition. a) The scheme shows the interaction between RPE and PR.[52, 53] b) The representative TEM images of the structure of RPE and the outer segment (OS) of PR of zebrafish at 72 hpf. The yellow asterisk indicates the damaged OS discs. The scale bar is 10 µm and 500 nm, respectively. c) KEGG pathway of the DEGs of RPE between control and InP/ZnS QDs exposure group based on the scRNA‐seq data. d) The representative images of mass spectrometry imaging (MSI) showed InP/ZnS QDs endocytosed by RPE. The In(115) was marked with green, and DNA (cell nuclei) stained with Ir(193) was marked with blue. The scale bar is 50 µm. e) The signal intensity of In(115) was determined using by ImageJ, n = 6. f, g) The expression level of splicing factors in RPE was analyzed by Rstudio f) and qPCR g), n = 4. h,i) The spliced, and unspliced mRNA level of gpx4b h) and fth1a i) were examined by Rstudio and qPCR j,k). l) The relative protein expression level of PRPF8 in hRPE cells after different doses of InP/ZnS QDs treatment. m) The representative images of the normal mitochondria left), ferroptosis center) and mitophagy right) mitochondria in control and InP/ZnS QDs exposure group. The purple arrow indicates ferroptosis, the blue arrow indicates mitophagy, scale bar is 1 µm and 200 nm, respectively. n) the C11 BODIPY staining measured the lipid peroxidation level in control and InP/ZnS QDs exposure group, scale bar is 30 µm. o) The representative images of the JC‐1 aggregate and JC‐1 monomer in control and InP/ZnS QDs exposure group. The scale bar is 30 µm. The data are presented as mean ± SE. Significant change among different groups (p < 0.05) is indicated by the different letters on the bar.

Mechanism of retinal degeneration induced by InP/ZnS QDs in zebrafish through inhibiting prpf8‐related splicesome and disrupting glutathione metabolism. a) The representative wild‐type larvae images of no injection control, injection with Cas9 protein, injection with sgRNA for prpf8, and co‐injection of Cas9 and sgRNA for prpf8. The scale bar is 1 mm and 500 µm, respectively. The eye distance of in X a1) and Y a2) axis, n = 24. b) Prpf8 overexpression alleviated the small eye size caused by InP/ZnS QDs at 72 hpf. The wild‐type embryos were divided four groups: injection of pCS2 plasmids with or without InP/ZnS QDs exposure and injection of pCS2‐prpf8 plasmids with or without InP/ZnS QDs exposure. The scale bar is 1 mm and 500 µm, respectively. The eye distance of in X b1) and Y b2) axis, n = 20. c) The representative wild‐type larvae images of no injection control, injection with Cas9 protein, injection with sgRNA for gpx4b, and co‐injection of Cas9 and sgRNA for gpx4b. The scale bar is 1 mm and 500 µm, respectively. The eye distance of in X c1) and Y c2) axis, n = 18–20. d) gpx4b overexpression alleviated the small eye size caused by InP/ZnS QDs at 72 hpf. The wild‐type embryos were divided four groups: injection of pCS2 plasmids with or without InP/ZnS QDs exposure and injection of pCS2‐gpx4b plasmids with or without InP/ZnS QDs exposure. The scale bar is 1 mm and 500 µm, respectively. The eye distance of in X d1) and Y d2) axis, n = 19–20. e) GSH rescued the small eye size caused by InP/ZnS QDs at 72 hpf. The wild‐type embryos were divided four groups: Control, GSH control, InP/ZnS QDs, and InP/ZnS QDs with GSH groups. The scale bar is 1 mm and 500 µm, respectively. The eye distance of in X e1) and Y e2) axis, n = 20. f) The representative images of Mito Tracker and LC3A/B in hRPE cells, Mito Tracker: red, LC3A/B: green, nuclear: blue, Coloca: colocalization of mitochondrial and LC3A/B, Scale bar is 10 µm. The representative TEM images of the structure of mitochondria hRPE cells in the four groups. The blue arrow indicates mitophagy and the scale bar is 1 µm and 200 nm, respectively g). h) The relative expression levels of proteins in hPRE cells after InP/ZnS QDs exposure with or without GSH treatment for 24 h. i) Schematic diagram of ferroptosis and mitophagy caused by InP/ZnS QDs in RPE cells. The data are presented as mean ± SE. Significant change among different groups (p < 0.05) is indicated by the different letters on the bar.

Acknowledgments
This image is the copyrighted work of the attributed author or publisher, and ZFIN has permission only to display this image to its users. Additional permissions should be obtained from the applicable author or publisher of the image. Full text @ Adv Sci (Weinh)