
|
Figure 1
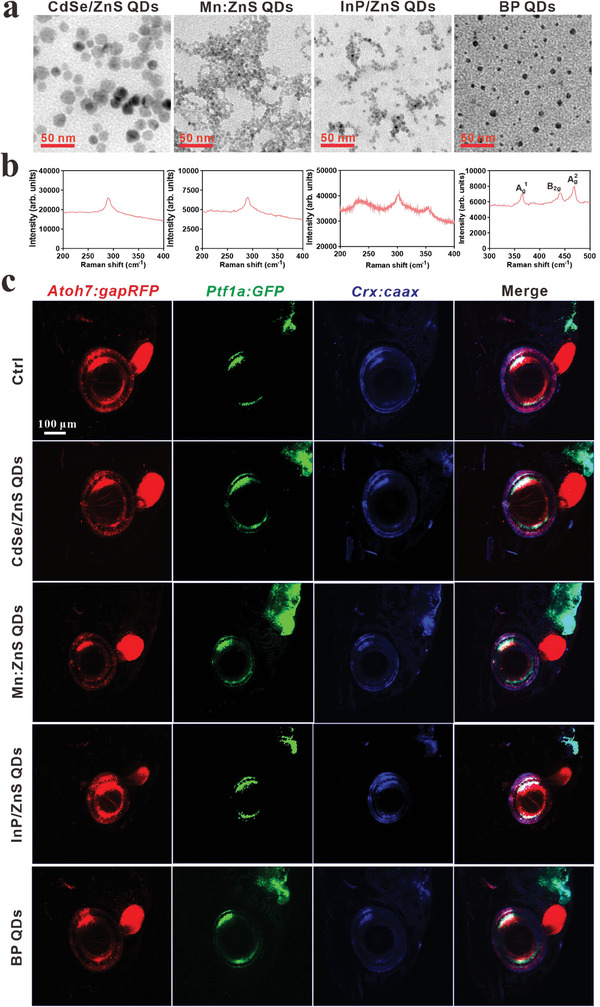
Characterizations of QDs and screening their impacts on the eye development of zebrafish. a) Representative images of QDs by TEM, scale bar, 50 nm. b) The Raman intensity of QDs. c) The lateral views of the effect of QDs (1 mg L−1) on retinal development in Tg (