
Figure 4
- ID
- ZDB-FIG-241212-34
- Publication
- Zheng et al., 2024 - Quantum Dots-caused Retinal Degeneration in Zebrafish Regulated by Ferroptosis and Mitophagy in Retinal Pigment Epithelial Cells through Inhibiting Spliceosome
- Other Figures
- All Figure Page
- Back to All Figure Page
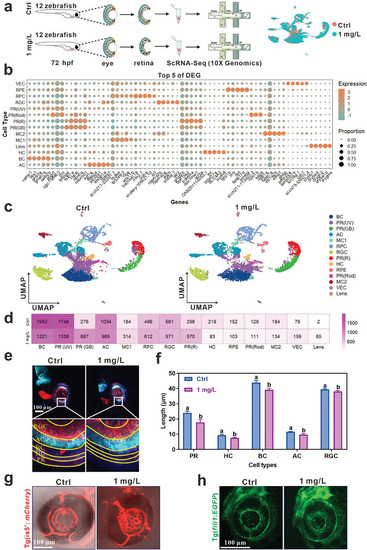
ScRNA‐seq analysis displayed the retinal degenerative damage of zebrafish exposed to InP/ZnS QDs at single cell level. a) Schematic illustration of the scRNA‐seq experimental design. We dissociated the retinas from zebrafish exposed to InP/ZnS QDs from 0.5 to 72 hpf (24 retinas of 12 larvae from each group). b) The top five DEGs of each cluster. c) UMAP plots show the clustering of qualified zebrafish eyes at 72 hpf. Distinct cell types are marked by different colors. d) The cell number of different clusters between control and InP/ZnS QDs‐exposed group. e) The representative images of the retina of Tg ( |