IMAGE

Figure 8

ID
ZDB-IMAGE-241212-87
Source
Figures for Zheng et al., 2024
Image
Figure Caption

Figure 8

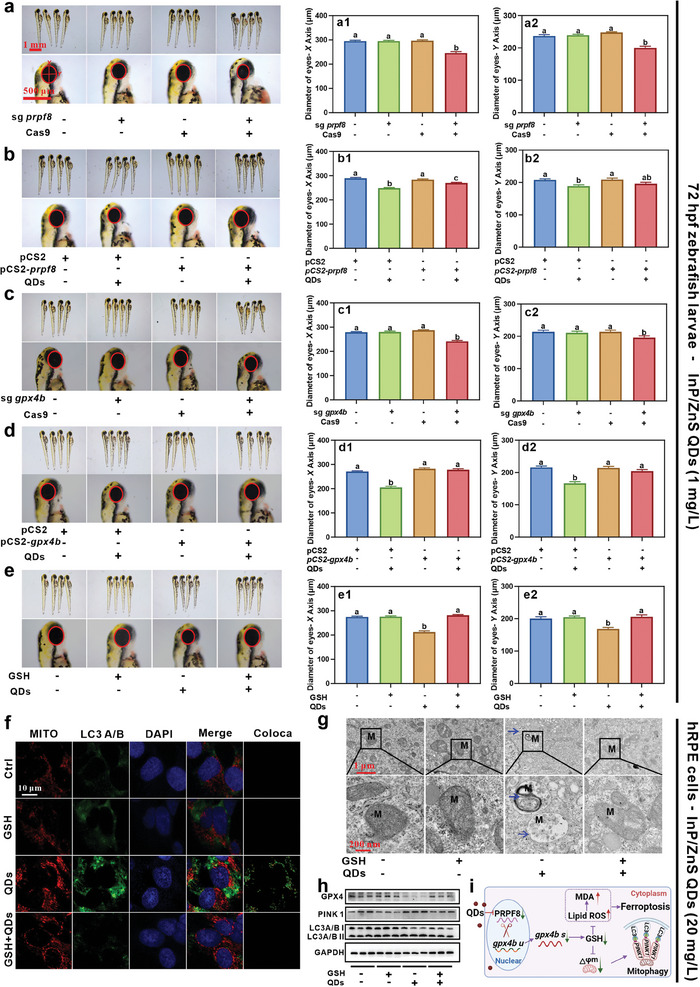
Mechanism of retinal degeneration induced by InP/ZnS QDs in zebrafish through inhibiting prpf8‐related splicesome and disrupting glutathione metabolism. a) The representative wild‐type larvae images of no injection control, injection with Cas9 protein, injection with sgRNA for prpf8, and co‐injection of Cas9 and sgRNA for prpf8. The scale bar is 1 mm and 500 µm, respectively. The eye distance of in X a1) and Y a2) axis, n = 24. b) Prpf8 overexpression alleviated the small eye size caused by InP/ZnS QDs at 72 hpf. The wild‐type embryos were divided four groups: injection of pCS2 plasmids with or without InP/ZnS QDs exposure and injection of pCS2‐prpf8 plasmids with or without InP/ZnS QDs exposure. The scale bar is 1 mm and 500 µm, respectively. The eye distance of in X b1) and Y b2) axis, n = 20. c) The representative wild‐type larvae images of no injection control, injection with Cas9 protein, injection with sgRNA for gpx4b, and co‐injection of Cas9 and sgRNA for gpx4b. The scale bar is 1 mm and 500 µm, respectively. The eye distance of in X c1) and Y c2) axis, n = 18–20. d) gpx4b overexpression alleviated the small eye size caused by InP/ZnS QDs at 72 hpf. The wild‐type embryos were divided four groups: injection of pCS2 plasmids with or without InP/ZnS QDs exposure and injection of pCS2‐gpx4b plasmids with or without InP/ZnS QDs exposure. The scale bar is 1 mm and 500 µm, respectively. The eye distance of in X d1) and Y d2) axis, n = 19–20. e) GSH rescued the small eye size caused by InP/ZnS QDs at 72 hpf. The wild‐type embryos were divided four groups: Control, GSH control, InP/ZnS QDs, and InP/ZnS QDs with GSH groups. The scale bar is 1 mm and 500 µm, respectively. The eye distance of in X e1) and Y e2) axis, n = 20. f) The representative images of Mito Tracker and LC3A/B in hRPE cells, Mito Tracker: red, LC3A/B: green, nuclear: blue, Coloca: colocalization of mitochondrial and LC3A/B, Scale bar is 10 µm. The representative TEM images of the structure of mitochondria hRPE cells in the four groups. The blue arrow indicates mitophagy and the scale bar is 1 µm and 200 nm, respectively g). h) The relative expression levels of proteins in hPRE cells after InP/ZnS QDs exposure with or without GSH treatment for 24 h. i) Schematic diagram of ferroptosis and mitophagy caused by InP/ZnS QDs in RPE cells. The data are presented as mean ± SE. Significant change among different groups (p < 0.05) is indicated by the different letters on the bar.

Acknowledgments
This image is the copyrighted work of the attributed author or publisher, and ZFIN has permission only to display this image to its users. Additional permissions should be obtained from the applicable author or publisher of the image. Full text @ Adv Sci (Weinh)