
- Title
-
CRISPR/Cas9-Mediated fech Knockout Zebrafish: Unraveling the Pathogenesis of Erythropoietic Protoporphyria and Facilitating Drug Screening
- Authors
- Wijerathna, H.M.S.M., Shanaka, K.A.S.N., Raguvaran, S.S., Jayamali, B.P.M.V., Kim, S.H., Kim, M.J., Jung, S., Lee, J.
- Source
- Full text @ Int. J. Mol. Sci.
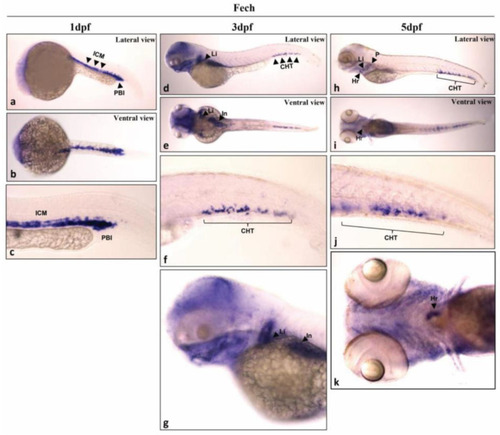
Spatial distribution of |

Tissue-specific expression of |

Generation and phenotyping of |
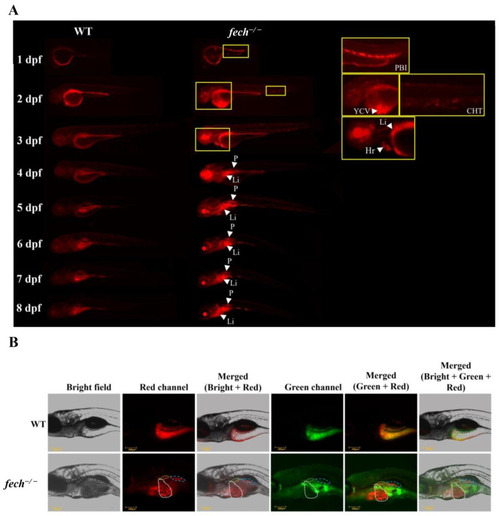
PPIX accumulation in |
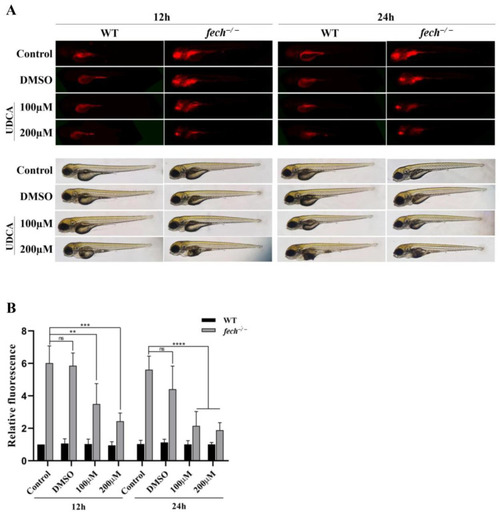
Reduction in PPIX accumulation in |
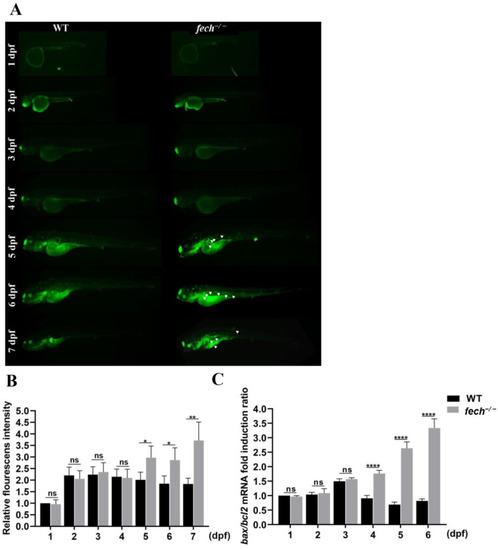
Apoptosis activation in |

Effect of UDCA treatment on apoptosis in |
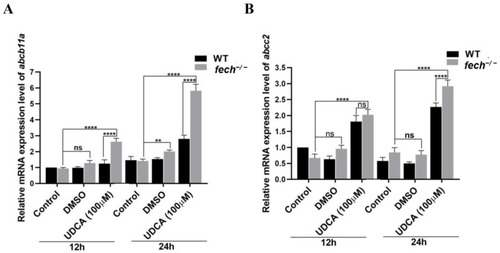
Effect of UDCA treatment on the expression of bile transporters in WT and |
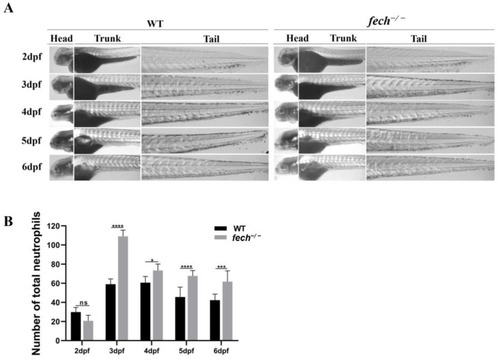
Temporal neutrophil production in |
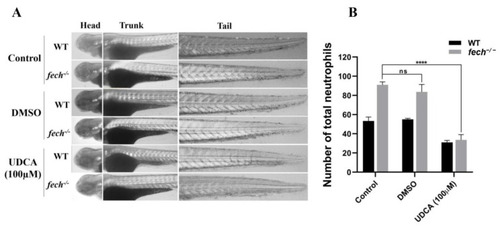
Amelioration of neutrophil accumulation by UDCA treatment in |
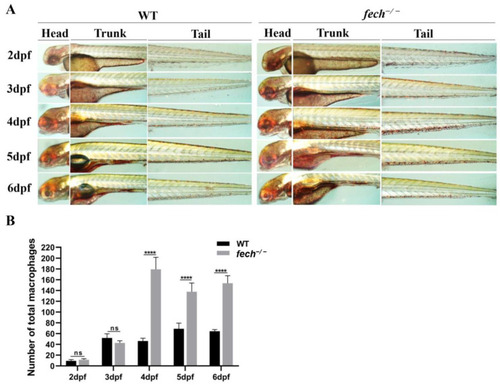
Changes in temporal macrophage production in |
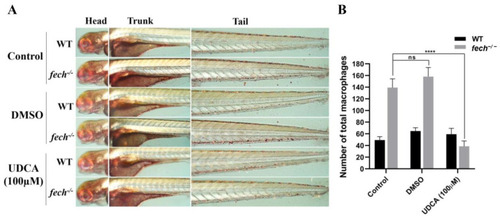
Attenuation of macrophage accumulation by UDCA treatment in |